The claim
Open nearly any candlestick textbook and you will find it: when a down candle is followed by an up candle whose body engulfs the previous body, buyers have “wrested control,” and — bought with the trend, stop below the pattern, target a multiple of risk — the setup is said to carry a positive edge. We did not invent this claim, soften it, or strawman it. We took the textbook definition, adapted it faithfully to intraday index futures, froze the specification before a single test ran, and put it through every examination in our protocol.
This is what the claim is worth.
What we tested
Instrument and window: ES (S&P 500 futures), continuous back-adjusted series (this page predates the engine and the unadjusted-data rule adopted in Teardown No. 3’s audit; every later page runs on unadjusted data), 15-minute bars built from 1-minute data, regular trading hours, January 2010 through December 2025 — sixteen years spanning two distinct volatility regimes.
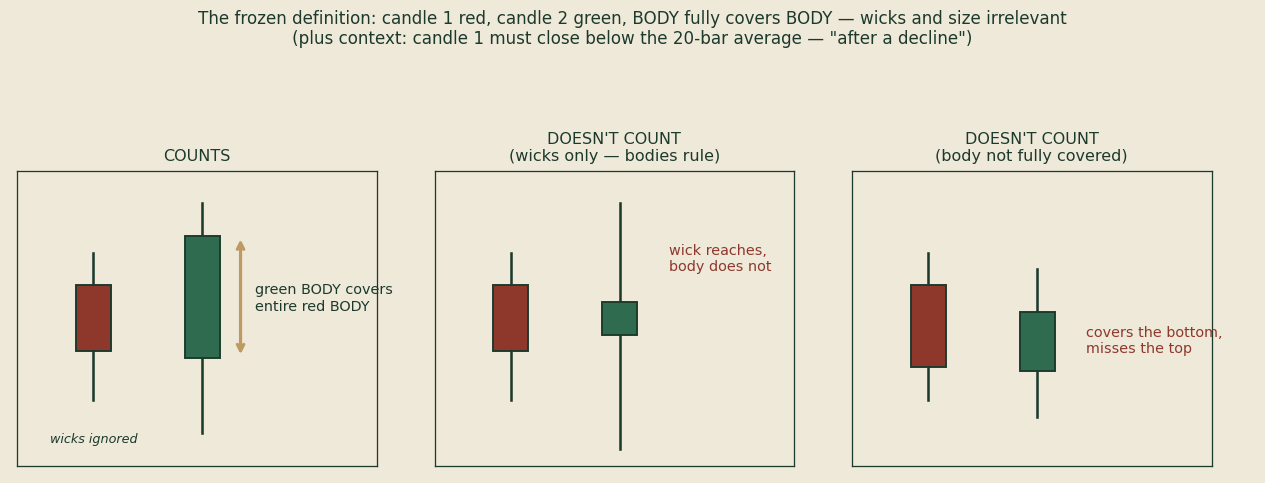
The pattern: a bearish body followed by a bullish body that engulfs it, in the direction of the prevailing trend (price above a simple moving average), long only, one position at a time. Two entry modes were tested (market at pattern completion; confirmation break of the pattern high) and three exit modes (2R target, 1R target, time exit), yielding a six-configuration matrix. The as-taught headline configuration — market entry, 2R target, 20-period trend filter — is the scored subject.
Honest frictions: $4.20 round-turn commission (verified to the penny as trades × rate on every run) and one tick per side slippage. Fill resolution was set to High (1-minute sub-bars), so intra-bar stop and target races resolve against the strategy the way a live market would — not in the flattering order a coarse backtest assumes.
The specification was frozen before testing. Every cell in the matrix runs and every cell reports. Changes require logged amendments. There is no drawer for results we dislike.
The results
Six configurations. Sixteen years. Every one of them lost money.
| Configuration | Entry / Exit | Trades | Net result | Profit factor |
|---|---|---|---|---|
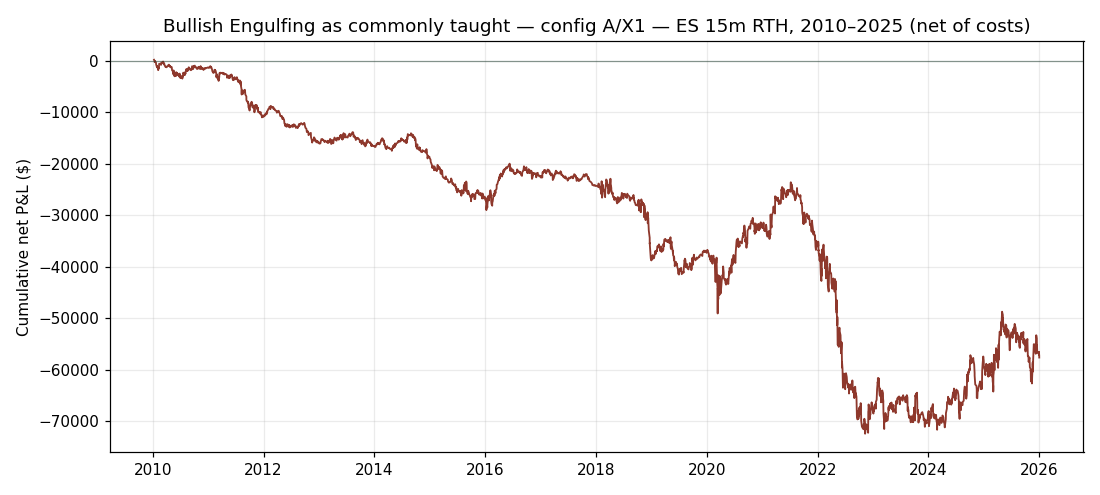
| A/X1 (as taught) | Market / 2R | 2,853 | −$57,608 | 0.914 |
| A/X2 | Market / 1R | 3,012 | −$60,350 | 0.90 |
| A/X3 | Market / time exit | 2,955 | −$28,486 | 0.95 |
| B/X1 | Confirm / 2R | 2,350 | −$36,845 | 0.94 |
| B/X2 | Confirm / 1R | 2,435 | −$77,827 | 0.86 |
| B/X3 | Confirm / time exit | 2,454 | −$23,007 | 0.95 |
The as-taught configuration lost in twelve of sixteen calendar years and in both eras of the window (2010–2019: −$36,994; 2020–2025: −$20,614). This is not one bad regime. It is a consistent bleed, twice. Only 30% of rolling twelve-month windows finished profitable. The 2R target — the textbook's promised payoff — was reached on fewer than one trade in five; the majority exit was the stop.
Where the money actually went
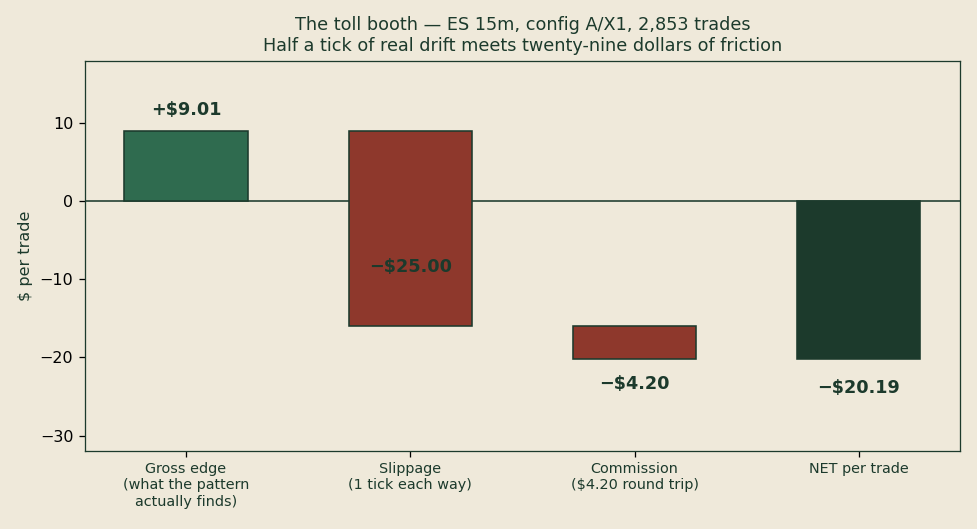
Decompose the average trade and the pattern's obituary writes itself. Before any costs, the average trade grossed +$9.01 — positive, and less than one tick of ES. After commission and slippage, it netted −$20.19. The pattern's entire gross edge is smaller than the cost of trading it. A bootstrap of five thousand resampled histories cannot distinguish the gross edge from zero — while the net edge is reliably negative.
This is the fate of most published patterns, and it is why no backtest with free fills should ever be believed.
Could better parameters have saved it?
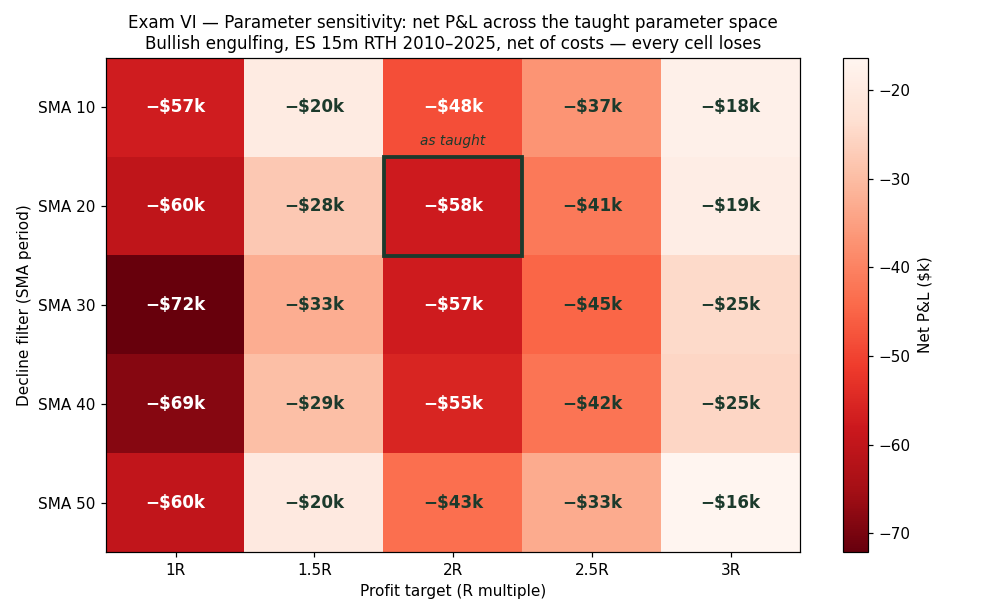
We ran the entire taught parameter space: five trend-filter lengths crossed with five profit targets, twenty-five configurations, each over the full sixteen years. All twenty-five lost money. The best cell in the grid lost $16,411; the worst lost $72,102. Hindsight optimization across everything the textbooks suggest tuning cannot produce a single profitable configuration. There is no needle to find and no plateau above water.
Compared to what? The coin-flip test
The decisive examination. We built fifty random-entry strategies — coin flips with the pattern's exact exit rules, position sizing, and costs — and ran each over the same sixteen years. If the engulfing pattern carries information, it should beat strategies that know nothing.
Thirty-one of the fifty beat it. That places it at the 38th percentile of pure chance — p ≈ 0.62, statistically indistinguishable from random entry. Its profit factor (0.914) sits a rounding error above the random median (0.882). The pattern that “shows buyers taking control” performs like a strategy that flips a coin and takes the same exits.
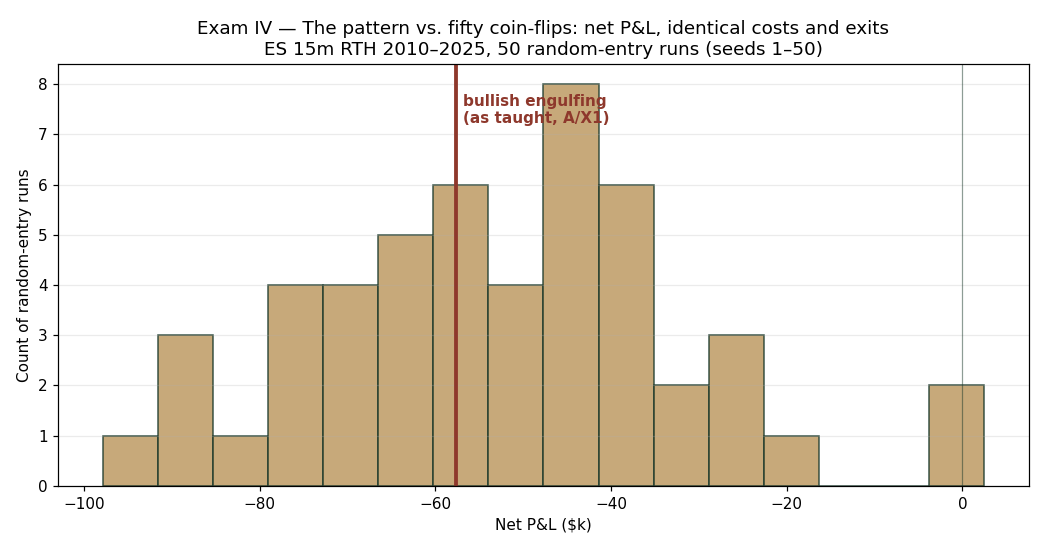
An interim export during this examination initially suggested the pattern was worse than all fifty coins. That claim was wrong — it came from a truncated export that kept only the top ten results — and it was caught, corrected, and retired before publication. The accurate claim is the one above: not worse than chance. Indistinguishable from it. We publish our corrections; a lab that reports zero errors is hiding them, not avoiding them.
The drawdown was not bad luck
Reshuffling the trade order five thousand times shows the realized −$72,633 drawdown sitting near the middle of the distribution (median −$71,900). The pattern did not stumble into an unlucky sequence. Losing this way is its typical behavior.
Full disclosure: the pulse we found while confirming the corpse
An honest lab reports everything the examination surfaced, including the parts that complicate the story.
In annex testing beyond the frozen intraday matrix, we ran the same pattern on slower charts. On 60-minute bars, and again on daily bars, the pattern's entries beat every cost-matched random control we threw at them — fifty of fifty coins at 60 minutes, fifty of fifty on daily. At slow timeframes, engulfing entries appear to carry some timing information relative to pure chance in this window.
Before anyone rushes to a chart, here is what that finding cannot survive yet: it was found by searching across timeframes (a multiplicity debt that discounts any single result), its profit is heavily concentrated — one year supplied 73% of the 60-minute result, and a single trade supplied 40% of the daily result — and in both cases the strategy's own profitability confidence interval touches or spans zero. Beating coins is not the same as making money: on daily ES over this window, 37 of our 50 literal coin-flip strategies were profitable, and one printed a profit factor of 4.35. A sixteen-year bull market writes résumés for anyone who shows up.
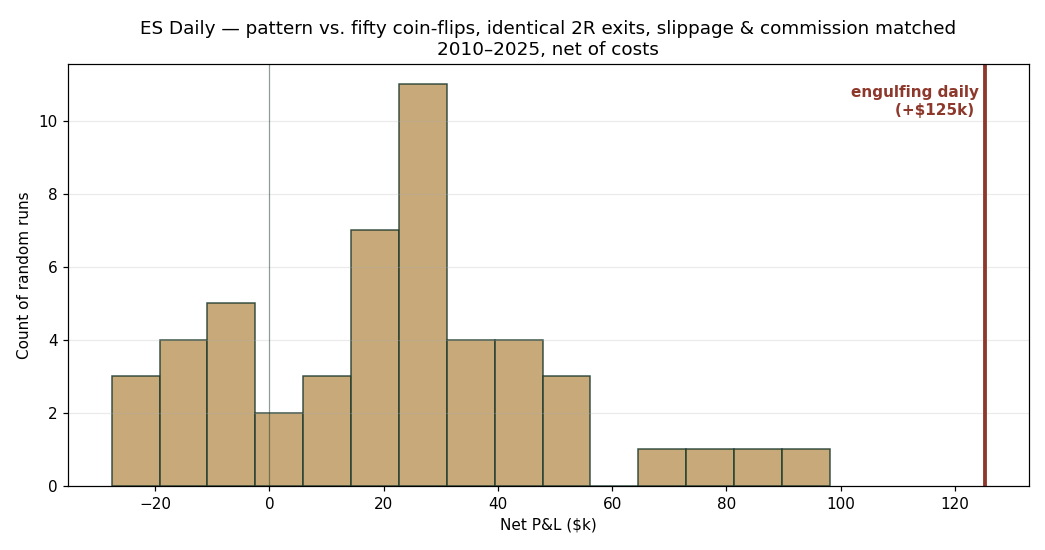
Classification: unconfirmed residual anomaly, flagged for a dedicated, pre-registered follow-up study with its own frozen specification. It does not alter the verdict on the claim as taught, which is about fast charts — and on fast charts the pattern is dead in every form we tested. On 5-minute bars it is deader still: more signals, same absent edge, more friction, net results near −$230,000 to −$244,000.
Verdict
REJECTED — 16/100. No auto-fail gates were tripped: the data was clean, the fills were honest, and the backtest reproduced exactly. That matters. This rejection is not “the test was invalid.” The evidence is valid. It says no.
The points the pattern did earn are worth understanding: full marks for the audit's own data integrity, partial credit for drawdown realism — it loses money predictably, not through hidden tail risk — and credit for simplicity. Every criterion that measures an actual edge scored zero. The single most important number in this report is not the −$57,608. It is p ≈ 0.62: after costs are matched, the entries contain no measurable information.
Reproducibility
Anyone with ES 15-minute data for 2010–2025, this page, and honest fill settings should land within Protocol tolerance (±10%) of the headline numbers. The specification above is complete: pattern definition, filter, exits, costs, and fill resolution. If you run it and land somewhere materially different, we want to hear about it — that is not a threat to this report; it is how the method works.
Questions people ask
Does the bullish engulfing pattern work for day trading ES? As taught, no. The textbook specification, frozen before testing, took 2,853 trades on ES futures from 2010 to 2025 and lost $57,608 after costs, with a negative result in both the early and the late era.
Is it better than entering at random? No. Against fifty random-entry strategies on the same days it came in at p ≈ 0.62, meaning random entry did as well or better about 62% of the time.
Would different settings have saved it? No. All 25 parameter combinations tested were negative, and six configurations of the pattern were run. The drawdown was not bad luck; it was the pattern.
Methods honesty — the correction ledger
Published as standard practice:
- Two provisional runs using a single-expiry instrument and coarse fill resolution were discarded and rerun after integrity checks.
- The first daily null was invalidated when an optimizer view-switch silently reset the date range — caught by a trade-count sanity check and rerun.
- A slippage setting silently reverted during the same view-switch and was caught before results were recorded.
- The truncated-export error described in the coin-flip section.
- September 6, 2026: the certificate row and the questions block said 5,000 random strategies; the test on this page was fifty, as the coin-flip section and Fig. 5 say. And the sentence “it beat 31 of 50” was the wrong way round: thirty-one of the fifty beat it, which is the 38th percentile and the p ≈ 0.62 printed everywhere else on the page. Both corrected in place, and a note added that the series was back-adjusted.
Commission arithmetic matched trades × $4.20 exactly on all runs.
A course, a bot, a signal room, or an evaluation you’d trade it in: the same test that made this page runs on the rule as the seller states it, for $49, before the card goes through. Read this before you pay →
The standing challenge
Convinced your variant survives? Once a month we take one reader-submitted variant of a previously torn-down pattern and test it free, under a frozen specification, and publish the result either way. Email audits@thinridge.io with the subject line “Standing challenge” and a one-paragraph description of the variant.