The rule
At 8:00 ET, note the open of the first one-minute bar. At 9:30 ET, note the close of the first one-minute bar. If the 9:30 close is 0.40% or more below the 8:00 open, buy at the next bar’s open; 0.40% or more above, sell short. Flat at 10:15 ET by market order. No stop, no target, one contract, NQ. One trade a day at most, and most days nothing happens.
Four numbers. That is the whole thing.
Disclosure
This is the examiner’s own rule. It was built by the person who runs this site, frozen on July 19, 2026, audited by hand in August under Protocol v1.0 (93/100), and then put through the same engine every stranger’s rule goes through, submitted through the public wizard on August 22 with nothing attached to it. The founder gets zero special treatment; the engine does not know who submitted it. The human audit record and the engine report are both on file, and the two scores are published side by side. If you think that is a conflict, you are right that it could be, which is why both documents exist and why the engine’s number is the one on this page.
It is published in full because a validated rule with the specification withheld is an advertisement, not an examination.
The verdict
90 out of 100. Validated. No gates tripped. Code offered: the standalone Python that produced every number below was generated, verified identical to the engine (709 trades, $113,297.20 to the cent), and attached to the report.
| Era | Years | Trades | Net result |
|---|---|---|---|
| Unseen (2008–2022) | 15 | 554 | +$63,693 |
| Seen, as declared (2023–2026) | 3.6 | 155 | +$49,604 |
| Full window | 18.6 | 709 | +$113,297 |
It made money in the years it was built on, which proves nothing. It made money in the fifteen years before that, which is the point. Twelve of fifteen unseen years positive.
The decade nobody tuned on
In the human audit, 2010–2019 was the verdict cell: 220 trades, +$16,081, profit factor 1.53. That is the highest profit factor of any cell in the matrix. The seen era made three times the dollars at a profit factor of 1.43. Fewer dollars, cleaner dollars. The same shape appears on RTY (unseen decade 1.42 against a seen era of 1.23). The era-manufactured signature is a rule that is sharp where it was tuned and blunt everywhere else; this is the reverse.
Year by year, unseen era
| Year | Net | Year | Net |
|---|---|---|---|
| 2008 | +$5,542 | 2016 | +$3,199 |
| 2009 | +$1,244 | 2017 | −$135 |
| 2010 | +$1,555 | 2018 | +$4,171 |
| 2011 | −$1,680 | 2019 | +$469 |
| 2012 | +$766 | 2020 | +$22,969 |
| 2013 | +$149 | 2021 | −$10,548 |
| 2014 | +$1,412 | 2022 | +$28,479 |
| 2015 | +$6,101 |
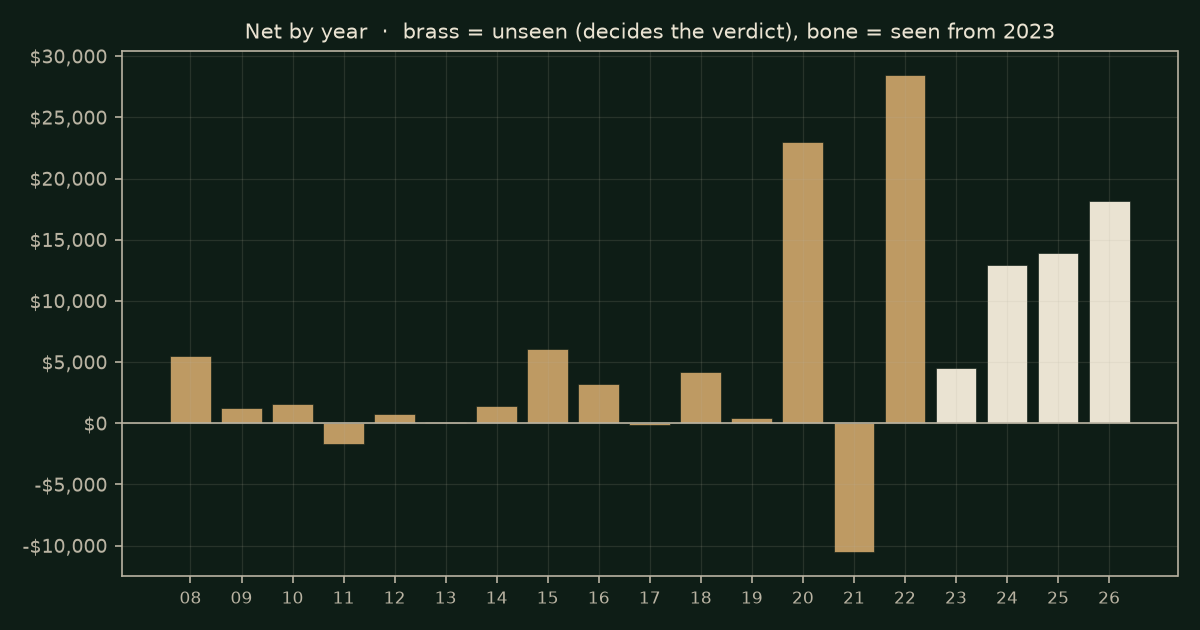
Read the column honestly. 2010 through 2019 is ten years of small numbers, about $16,000 across some 220 trades. 2020 and 2022 are $51,000 of the $64,000 unseen total; 2022 alone is 45% of it, and that one line cost the rule two of its ten lost points. The edge is real and persistent. It is large only in years when the Nasdaq is moving half a percent before the bell, and those years do not announce themselves.
Compared to what? The coin-flip test
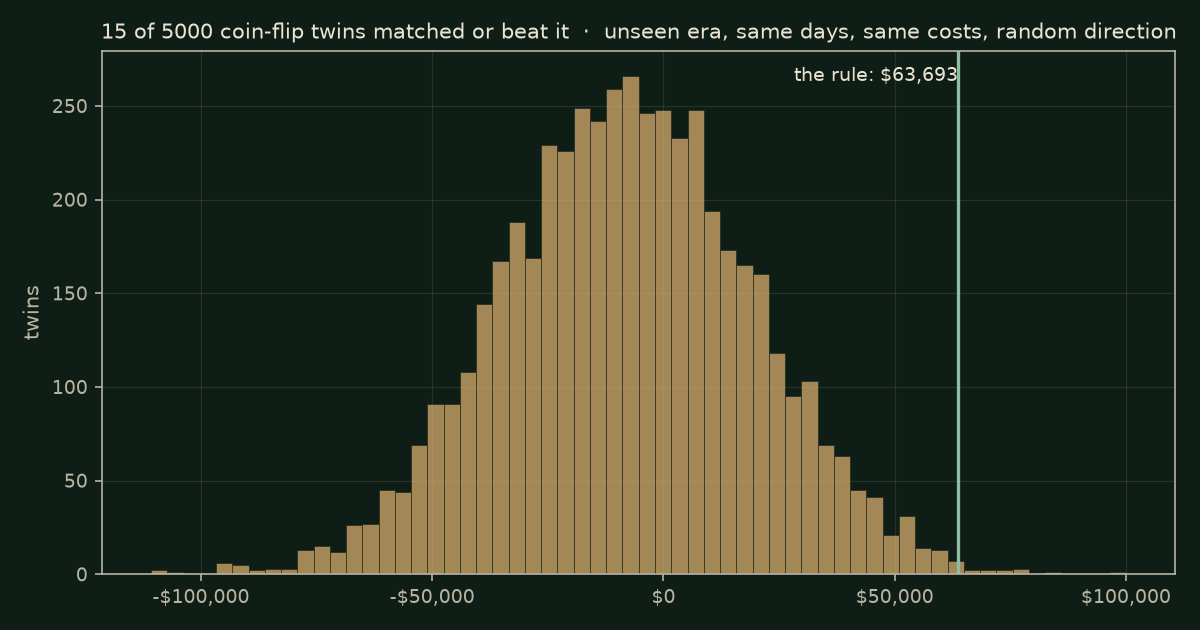
Five thousand twins, same days, same costs, coin-flip direction. Unseen era, which governs: p = 0.0030. Fifteen twins out of five thousand did as well. Full window: 0.0014.
Costs
Net is 92% of gross at one tick per side; the rule keeps what it makes. Two ticks per side: +$106,207. Three: +$99,117. Breakeven is 17 ticks per side. You could pay seventeen times the normal spread and still be above water. Compare the opening range breakout, Teardown No. 2, at 1.7.
Concentration and fragility
Top trade 20.6% of net; top five 42%. A bootstrap of five thousand resampled histories puts the unseen-era net between +$12,788 and +$118,338, with P(net > 0) = 0.99. Move the threshold ten percent either way: 115% plateau retention, no sign flip.
Livability
The score says whether the edge is real. This section says whether a person could have held it. No points attach, and it is the reason this page exists.
| Longest stretch without a new equity high | 46 months (ending September 2014) |
| Rolling 12-month windows that lost money | 22% of 213 |
| Worst 12 months | −$10,548 (ending December 2021) |
| Maximum drawdown | $19,938 — 38th percentile of its own reshuffled histories; normal for this rule |
| Median year | +$3,199 |
| Years of median to recoup the drawdown | 6.2 |
| Share of all profit from the best two years | 45% |
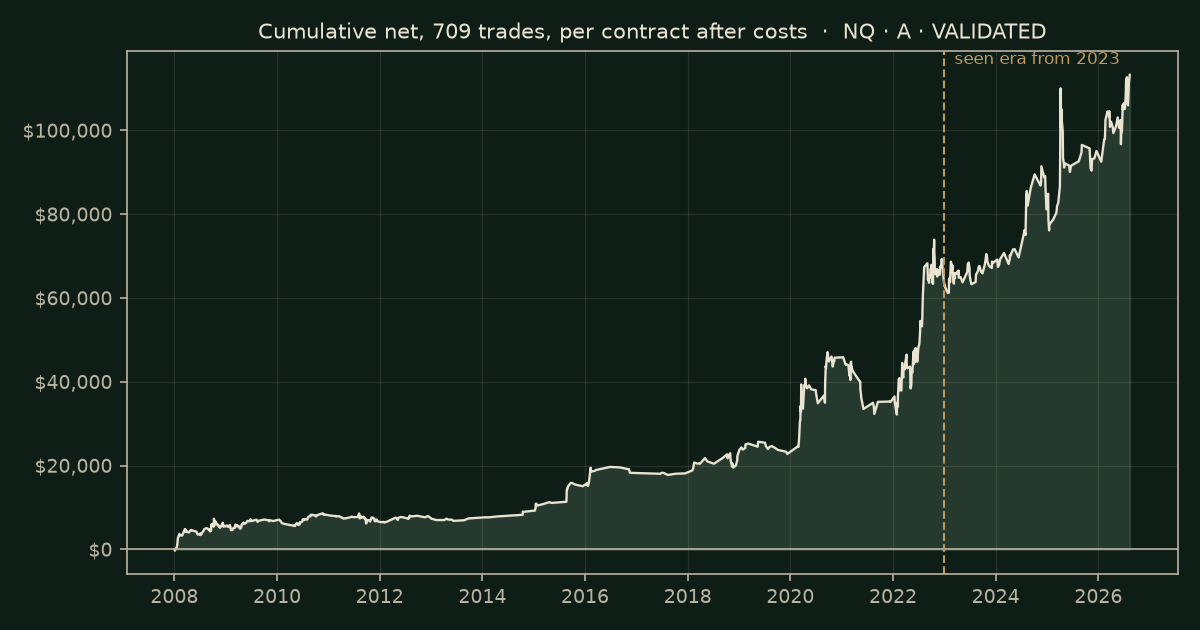
Here is the honest version. From 2010 to 2019 this rule paid about $1,600 a year on one contract, with a losing year and a flat year in there, and spent most of 2021 giving back. Nobody lives on that. The years that made it look like something were 2020 and 2022, and you had to have been running it through the dead decade to be there for them. A real edge and a livable one are not the same thing, and the score only measures the first.
Three instruments
| Market | Trades | Net | Score | Unseen p | Breakeven | Months to a new high | Median year |
|---|---|---|---|---|---|---|---|
| NQ | 709 | $113,297 | 90 | 0.0030 | 17.0 | 46 | $3,199 |
| ES | 545 | $45,674 | 89 | 0.0024 | 4.3 | 55 | $2,658 |
| RTY | 789 | $39,551 | 92 | 0.0008 | 6.0 | 36 | $1,742 |
Same four numbers, three index futures, no re-tuning. The rule is not an NQ artifact. Note that RTY scores highest and has the smallest median year; the score and the livability of a rule are different questions, and they can answer in opposite directions.
Verdict
VALIDATED — 90/100. No gate tripped. The data was clean (6,180,656 bars, zero anomalies), the fills were honest (next-bar-open market orders, one tick adverse per side), and the result reproduces from the rule text above, on two independent pipelines, within 3%. The evidence is valid. It says yes, and it says what yes costs.
Reproducibility
Anyone with NQ 1-minute data for 2008–2026 and the four numbers above should land within Protocol tolerance (±10%) of 709 trades and +$113,297 net at $4.20 commission and one tick per side. NinjaTrader 8 on a different data feed landed at 539 trades and +$102,266 on the 2010–2026 audit window against the engine’s 541 and +$105,368 (+3.0%), direction agreeing on 534 of 534 shared days. The full engine report, number dfd2dbd5a1, and the human audit record PA-26-0001 are on file. If you run it and land materially elsewhere, we want to hear about it.
Questions people ask
What is the premarket move fade? Mark the price at 8:00 ET. At 9:30, if price has moved at least 0.40% from that mark, trade against the move at the next bar's open and get out at 10:15. Both directions, one contract, no stop. Four numbers, all printed on this page.
Is it real or curve-fit? 12 of the 15 years nobody tuned on were positive, 15 of 5,000 coin-flip twins did as well or better on those years, and the result survives 17 ticks per side of friction. The specification was published in full and the human audit sits beside the engine's.
Could a person actually have traded it? The hard part: it went 46 months without a new equity high, from 2010 into 2014. The livability section on this page shows every such stretch, so you decide with your eyes open.
Does it work on other markets? The same rule, unchanged, also validated on ES, RTY, YM, the S&P MidCap and the MSCI EAFE contracts: six of the 65 markets on the engine, all stock indices; four were marginal and 55 rejected. The four indices run together as one book are not livable, because they sleep through the same years. That work is on the Search No. 1 page.
Methods honesty — the correction ledger
- The human audit (93) and the engine (90) differ by three points, all in Exam IV: the engine applies Protocol v1.1’s trade-concentration line (top trade 20.6% → 1 of 3) and a slightly different drawdown-realism ratio. Under v1.1 the human audit re-scores to 92. All three numbers are published.
- During the human audit the primary data was switched from back-adjusted to non-adjusted continuous after additive back-adjustment was found to inflate early-year prices and silently stretch the 0.40% threshold. All cells were re-run. Logged as Amendment #1 in the audit record.
- The examiner predicted 2008 as the rule’s largest unseen year; it was 2022. The pipeline’s seen-from year was then made a declared wizard field rather than an archive-date guess.
- September 6, 2026: the questions block said the rule “failed on 55 of 65 markets outside stock indices”; the sweep’s count is six validated, all stock indices, four marginal and 55 rejected, of 65 in all, and the sixth validated market, the MSCI EAFE contract, was missing from the list. The certificate’s band line said 80 and above; the Validated band under Protocol v1.1 is 70 and above with no pillar under half its points and no gate, as the home page states. All corrected in place.
What this cannot tell you
The score assumes this rule walked in once, and that development did not touch 2008–2022. In this case the contamination map was taken under testimony in the human audit: 2023 onward seen; 2020–2022 lightly seen and reclassified under oath; 2010–2019 never looked at before the freeze. That is the one thing a stranger’s report does not have. The engine’s 90 is what the rule scores with nothing sworn; the human 93 is what it scores with the map.
The code that produced every number on this page is the code that is offered with a validated report. It is the same file. Not a trading system, not advice.
Where the money was
The money was made by noon: 100% of the unseen-era money was on the books by 12:00. Longest wait for a new equity high: 46 months, median year $3,198.60.
No next run is pointed at: no single change is pointed at; the verdict stands as written.
If you trade this by eye
It is real and it is slow: 46 months without a new high is in the record, so size to the drought, not to the win.
That is what the record says about the rule as written. It is not what next year says.
A course, a bot, a signal room, or an evaluation you’d trade it in: the same test that made this page runs on the rule as the seller states it, for $49, before the card goes through. Read this before you pay →
The standing challenge
Think this rule breaks with a stop, a filter, or a different market? Submit the variant at thinridge.io; a report is $49, and a filter is scored as a second strategy with base and filtered shown side by side. Once a month we take one reader-submitted variant of a published rule, test it free under a frozen specification, and publish the result either way.