The rule
The plain opening range breakout from Teardown No. 2, restricted to one weekday. High and low of the fifteen minutes from 9:30 ET; first one-minute close outside that range, no later than 11:30, enters with the break at the next bar’s open; both directions; no stop; market out at 15:30 ET. Fridays only — the filter skips Monday through Thursday. One contract, NQ, $4.20 round-turn commission and one tick per side of slippage, same as every run this engine does.
Submitted through the public wizard on August 24, 2026, declared version #6 — the base rule plus the five weekday slices examined to find this one. The engine counts a filter as one more version, so the exam ran at lineage #7. That declaration is the spine of this page.
Where it came from
A reader thread asked what the breakout did on individual weekdays. The split was run in public: Monday +$11,914, Tuesday +$2,909, Wednesday −$108,292, Thursday −$14,660 — and Friday, +$141,740, a result that beat every one of 2,000 cost-matched coin-flip twins. The finding was posted with a warning attached: the money looked era-concentrated, the slice was the best of five examined, and nobody should trade it off that table. Then it was submitted here, with the search declared, to let the exam say what a warning cannot: how much of the Friday result survives honest arithmetic.
One procedural note that belongs on the record: the weekday study and this engine are separate code paths, and their Friday accounting agrees to the dime — the 2008–2012 Friday cells sum to $1,457.60 in both. The anomaly was found by one instrument and confirmed by a second.
The verdict
85 out of 100. Validated. No gates tripped. And in the same report, the code gate — the strictest standard in the house, the one that decides whether the standalone Python ships with the report — checked its five conditions and found one unmet: at lineage #7, the adjusted probability that this result is luck is 0.0626, and the gate requires 0.05. No code was offered.
Hold both sentences at once, because the pair is the product. The score measures whether the directional information in the entries is real; on the evidence below, it is. The code gate asks a harder question — is it real after paying full price for how it was found — and by that standard the answer is: not quite, not yet. A tool that could only say one of those two things would be lying by omission.
What the filter did
| Base rule (all days) | Fridays only (scored) | |
|---|---|---|
| Trades | 4,708 | 925 |
| Net, full window | +$33,611 | +$141,740 |
| Unseen era net (2008–2022) | −$19,979 | +$76,037 |
| Unseen-era p vs. coin flips | 0.3412 | 0.0092 |
| Breakeven, ticks per side | 1.7 | 16.3 |
| Top trade’s share of net | 93.9% | 11.0% |
The base rule lives inside the spread and one trade is nearly all of it. The Friday version breaks even at sixteen ticks of friction per side and no single trade matters. Whatever this is, it is not the base rule wearing a costume — it is a different animal, which is exactly why a filter is scored as a second strategy and shown beside the first.
Year by year, unseen era
| Year | Net | Year | Net |
|---|---|---|---|
| 2008 | +$2,451 | 2016 | +$741 |
| 2009 | +$324 | 2017 | −$5,060 |
| 2010 | −$1,091 | 2018 | +$11,604 |
| 2011 | −$1,992 | 2019 | +$14,159 |
| 2012 | +$1,765 | 2020 | −$1,752 |
| 2013 | −$1,346 | 2021 | +$26,704 |
| 2014 | −$542 | 2022 | +$29,620 |
| 2015 | +$450 |
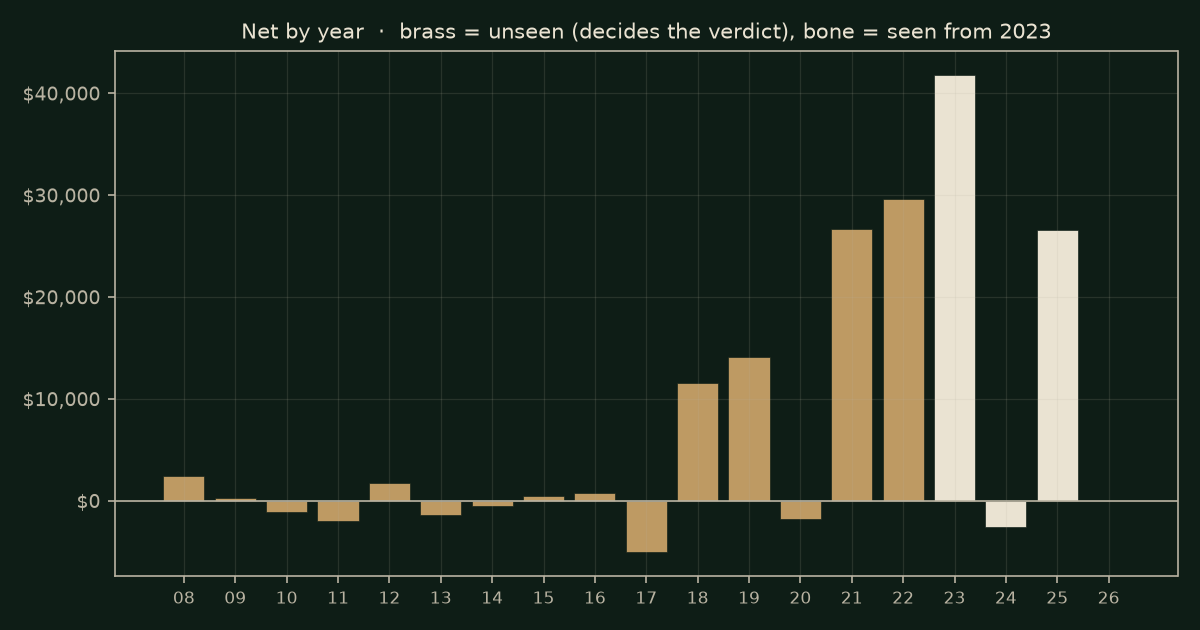
Nine of fifteen unseen years positive, walk-forward efficiency 0.99, and the largest year is 39% of unseen-era net — concentration below the level that costs points. That is the case for the score. Now read the same table again: from 2008 through 2017 the amounts are noise-sized, a few hundred to a few thousand dollars either way. The rule did not lose for a decade. It made nothing for a decade, indistinguishably from chance, and then 2018 arrived. Both readings are true, and the exam prices each one where it belongs.
Compared to what? The coin-flip test
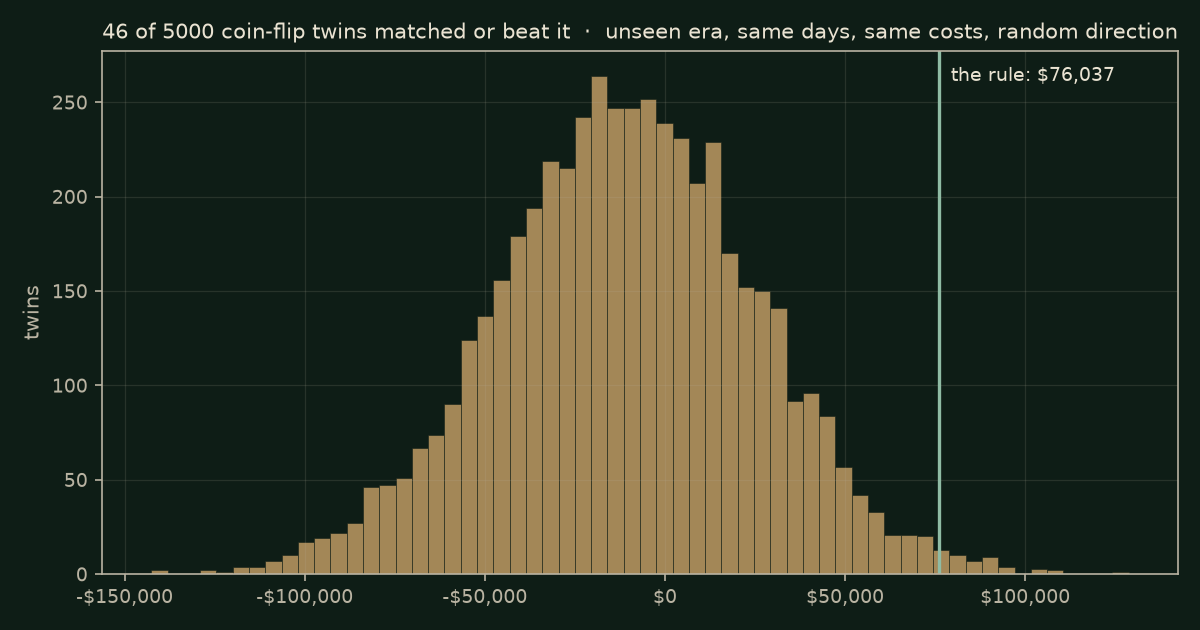
Five thousand twins, same Fridays, same costs, coin-flip direction. Full window: p = 0.0044 — 22 of 5,000 twins matched it. Unseen era, which governs: p = 0.0092 — 46 of 5,000. Then the lineage correction: seven looks at the data means the honest question is not “how rare is this result” but “how rare is the best of seven results,” and 1 − (1 − 0.0092)7 = 0.0626. That is the number the code gate read, and the number this page stands on.
Costs
Net is 91.5% of gross at one tick per side. Two ticks: +$132,490. Three: +$123,240. Breakeven is 16.3 ticks per side — roughly ten times the friction the base rule could carry. Profit factor at double friction: 1.30. Whatever else is said below, this result is not an artifact of optimistic fills.
Sensitivity
Plateau retention 112% — the neighbourhood around the locked parameters is at least as good as the parameters themselves. No sign flip. Five parameters, counting the filter. The result is not perched on a tuned spike.
Livability
The score says whether the edge is real. This section says whether a person could have held it. No points attach — and on this rule, this section is the verdict most readers actually need.
| Longest stretch without a new equity high | 110 months (ending June 2018) |
| Rolling 12-month windows that lost money | 39% of 213 |
| Worst 12 months | −$19,068 (ending January 2025) |
| Maximum drawdown | $32,557 |
| Median year | +$450 |
| Years of median performance to recoup the drawdown | 72.3 |
| Share of all profit from the best two years | 50% |
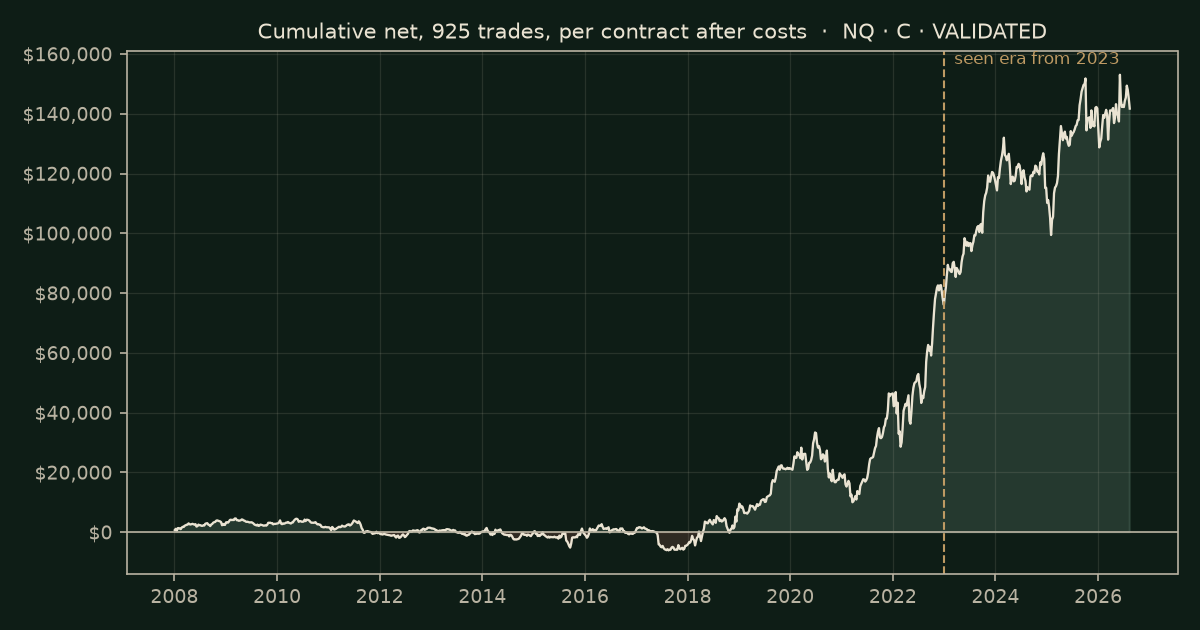
Read the middle rows twice. The typical year of this Validated rule made $450. Its maximum drawdown would take seventy-two years of typical performance to earn back. A person who started trading it in 2009 waited nine years for a new equity high, on one trade a week, through a drawdown they had no way of knowing would ever end. On a funded account with a trailing drawdown, this rule is unrunnable; in a personal account it is a decade-long act of faith that happened, this time, to be rewarded. The pattern is real. A person is not a pattern.
And the obvious fix — add a stop so a person can hold it — was run. Same 925 Fridays, same costs, stop one range-width from the fill, time exit kept as the backstop:
| Exit | Net, full | Net, unseen | Unseen p | Twins that beat it |
|---|---|---|---|---|
| No stop, flat 15:30 ET (scored) | +$141,740 | +$76,037 | 0.0092 | 46 of 5,000 |
| Stop only, no target | +$77,100 | +$27,077 | 0.064 | 318 of 5,000 |
| Stop, target 1R | +$25,075 | −$3,138 | 0.357 | 1,785 of 5,000 |
| Stop, target 2R | +$42,120 | +$19,847 | 0.083 | 416 of 5,000 |
| 25-point stop, 50-point target | +$1,880 | −$1,743 | 0.144 | 721 of 5,000 |
The moment the rule acquires the thing that makes it tradeable, it stops being validated. A stop alone turns 46 twins into 318 and pushes p past the bar; a target finishes it. That is the whole distance between the two words in this page’s verdict, measured.
Verdict
VALIDATED — 85/100. Code not offered. The data was clean (6,180,656 bars, zero anomalies), the fills honest, the search declared, and the result reproduces from the rule text above. The entries carry directional information that 5,000 random-direction twins could not fake, in fifteen years the search never touched. And at the declared lineage, the residual chance that the whole thing is a selection artifact — 6.26% — is exactly large enough that the engine keeps the code. If Fridays keep doing what they have done since 2018, the number will cross the bar on its own. If they stop, it won’t. Either way, the machine will not round 0.0626 down to yes — not for a stranger, and not for the person who built it.
Reproducibility
Anyone with NQ 1-minute data for 2008–2026 and the rule as written above should land within Protocol tolerance (±10%) of 925 trades and +$141,740 net at $4.20 commission and one tick per side. The full engine report, number dd8b4d0151, is on file. If you run it and land materially elsewhere, we want to hear about it.
Questions people ask
Is the opening range breakout better on Fridays? On 18 years of NQ, yes: Fridays alone made $141,740 on 925 trades, against $33,611 for the whole week, and 9 of 15 unseen years were positive. Wednesdays lost $108,292.
Why doesn't the site offer the code for it? Because Friday was found as the best of five weekday slices, not declared in advance. Counting those looks, the adjusted probability that a coin flip does as well is 0.063, above the 0.05 the code gate requires. The page says exactly how it was found.
Is it a payday effect? No. Payday Fridays, the one nearest the 15th and the last of the month, made $39,299 on 424 trades; the other Fridays made $102,441 on 501. Whatever Friday is, it is not the paycheck.
Methods honesty — the correction ledger
- The examiner registered, before the run, an 85% probability that this rule would not validate. It validated. The prediction is scored as a miss, on the record, and this page exists partly because the miss was more informative than a hit would have been.
- The public thread post describing the base rule omits its 11:30 entry cutoff; the scored record contains it. Run the post’s literal wording and the base rule shows 4,782 trades and +$23,081 instead of 4,708 and +$33,611. The weekday study’s first draft made exactly this error, was caught by its reconciliation gate before anything was published, and was corrected against the record. Both numbers are disclosed here so nobody has to discover the gap the hard way.
- The five-weekday search that produced this rule was run and published before the idea of submitting it existed. The declared lineage of six (plus the filter) reflects that search. If the search had been wider than declared, every probability on this page would be too generous. That assumption is stated, not sworn.
- September 6, 2026: the certificate’s band line said 80 and above; the Validated band under Protocol v1.1 is 70 and above with no pillar under half its points and no gate, as the home page states. Corrected in place.
What this cannot tell you
Why Fridays. The exam measures that the effect is present; it has no opinion on mechanism, and “weekly positioning flows” is a story, not a finding. It also cannot tell you the effect will persist — every dollar of comfortable profit here arrived after 2017, and a regime that began in 2018 can end. And it cannot make a $450 median year worth a decade of your attention. Validated and tradeable are different words. This page is the first one; nothing on it is the second.
Where the money was
The condition is the rule: without it the unseen years made -$19,978.60; with it, $76,037.00. The money lived after noon: 84% of the unseen-era money was on the books after 12:00. Longest wait for a new equity high: 110 months, median year $450.00.
No next run is pointed at: no single change is pointed at; the verdict stands as written.
If you trade this by eye
Patience past noon is where this rule's money has lived; before noon it paid costs for nothing.
It is real and it is slow: 110 months without a new high is in the record, so size to the drought, not to the win.
That is what the record says about the rule as written. It is not what next year says.
A course, a bot, a signal room, or an evaluation you’d trade it in: the same test that made this page runs on the rule as the seller states it, for $49, before the card goes through. Read this before you pay →
The standing challenge
Once a month we take one reader-submitted variant of a published rule, test it free under a frozen specification, and publish the result either way. This teardown is itself a product of that process — the weekday split existed because readers asked for it. If you trade a version of this rule with a different filter, write the filter down in numbers and submit it at thinridge.io. A filter is scored as a second strategy and shown beside the base, and your lineage declaration will be held to the same standard this one was.