The shelf · Order block · E-mini Nasdaq-100
Order block on NQ
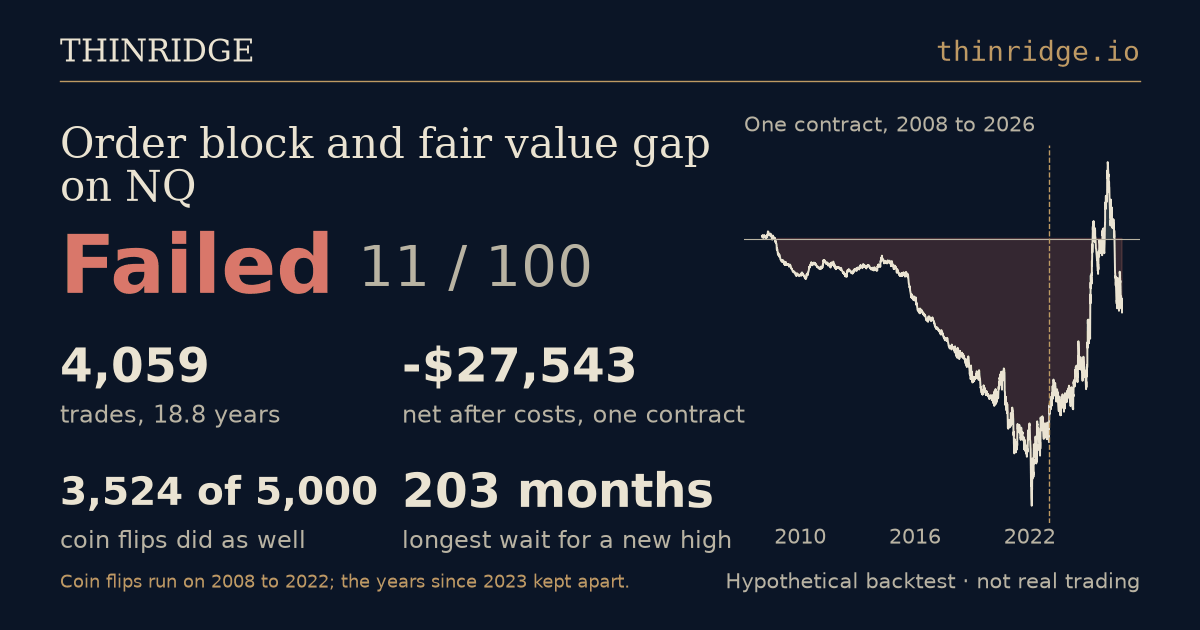
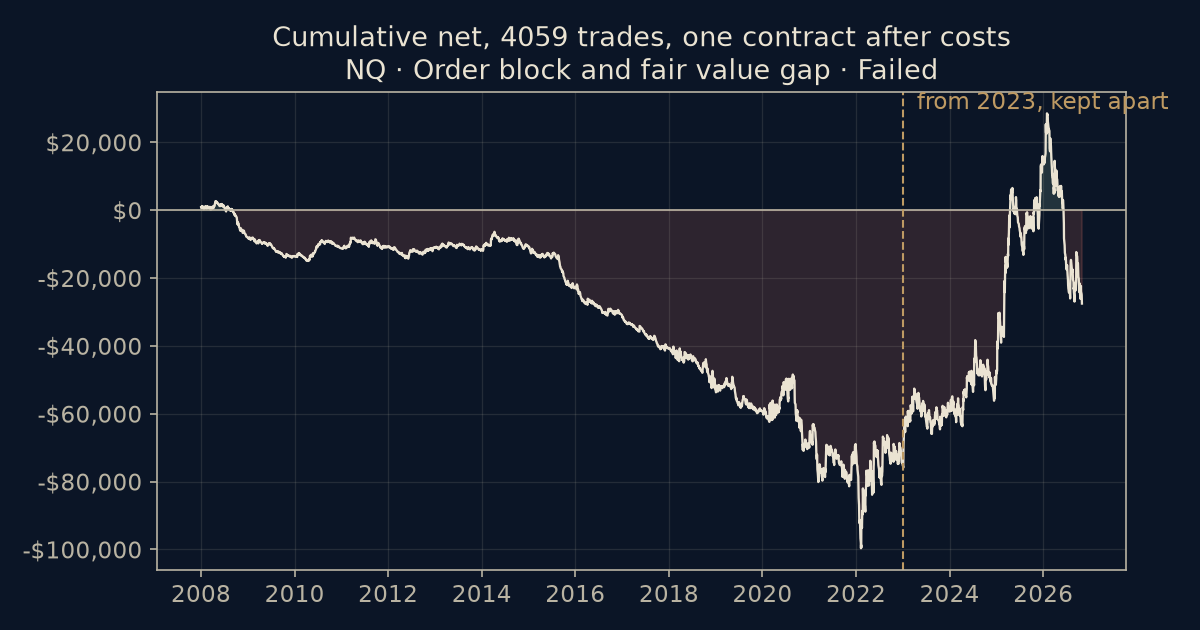
Short answer: no, it does not pass. Order block on NQ, tested by Thinridge on 18.8 years of one-minute E-mini Nasdaq-100 futures data (2008 to 2026) with costs on every trade, lost $27,543 net for one contract over 4,059 trades; 3,524 of 5,000 coin-flip copies of it (the same trades, the side picked at random) did as well or better on the years before 2023. Verdict: Failed, 11 of 100.
Where it breaks, and what to change ↓
On 5-minute bars: a close above the last swing high makes the last down bar before it the zone. The first return to the zone within two hours that closes back above it buys, with the stop under the zone; the mirror on the way down. Between 9:45 AM and 3:00 PM; out at 3:30 PM. Run on NQ, the E-mini Nasdaq-100. Times are New York time.
What these settings mean
- follow: trades in the direction of the break or signal.
- long and short: takes both buys and sells.
- window: a new trade can start only between these two times.
- out: any trade still open is closed at this time.
- stop past the setup’s extreme: a stop-loss just beyond the setup’s own high (for a sell) or low (for a buy); no profit target.
- bars: the setup is read on bars of this many minutes.
- swings: a swing high (or low) is a bar with this many lower highs (or higher lows) on each side of it.
- The other settings are the setup’s own; the sentence above says what they do.
Tested as written above: a stop one tick past the extreme the setup names, no target, out at 3:30 PM. A different stop or target is a different strategy, with its own result: Test your version →
Hypothetical backtest: one contract, after costs, not real trading. Simulated results have limits: they are not actual trading, they are made with the benefit of hindsight, and no account is likely to achieve results like these. The standard statement
How to read the score. It has to beat 5,000 coin flips on the 15 years before 2023 (2008 to 2022, kept apart from the years since 2023): the same trades with the side picked at random, so they test the side it takes, not when it trades. The years-before-2023 check and the year-by-year check are scored on those years too: with the coin flips, 60 of the 100 points; the other three use all 18. A high score doesn’t mean easy to hold: read the longest wait for a new high. A score is how the setup did against our published checks on 2008 to 2026; it is not a forecast, and what it does next is unknown. How a score is made.
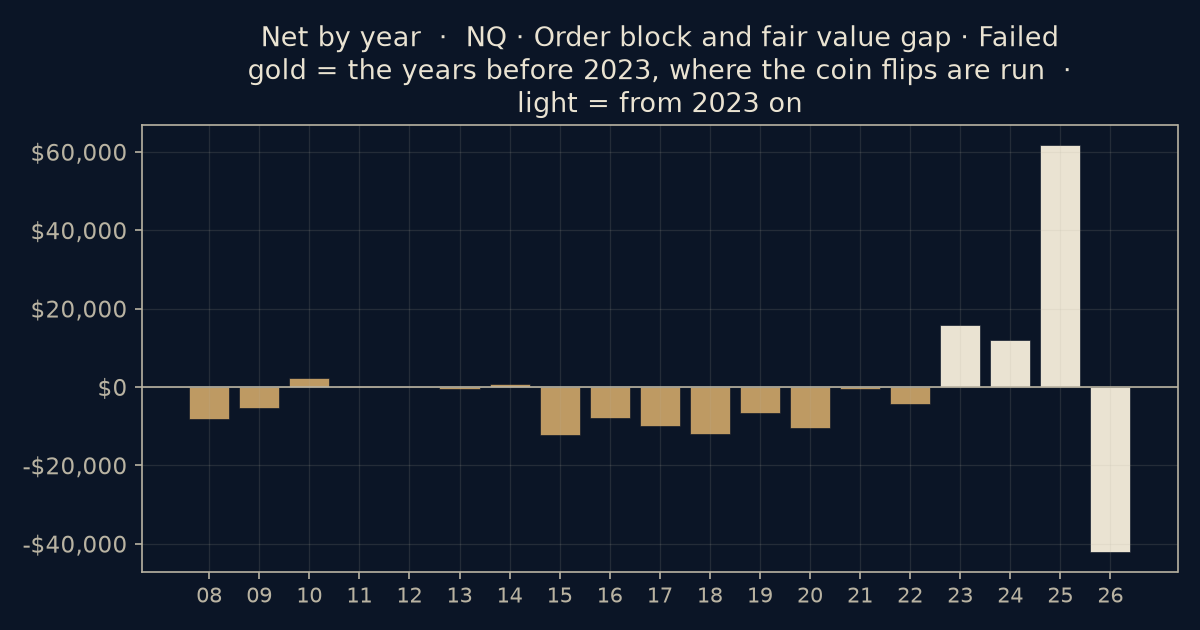
2008 to 2022: 3,241 trades, -$75,027. Since 2023, the years kept apart: 818 trades, $47,484.
The level did not hold: 68% of trades ended at the stop, which sits where the setup says price should not go; the setup's premise failed more often than it held.
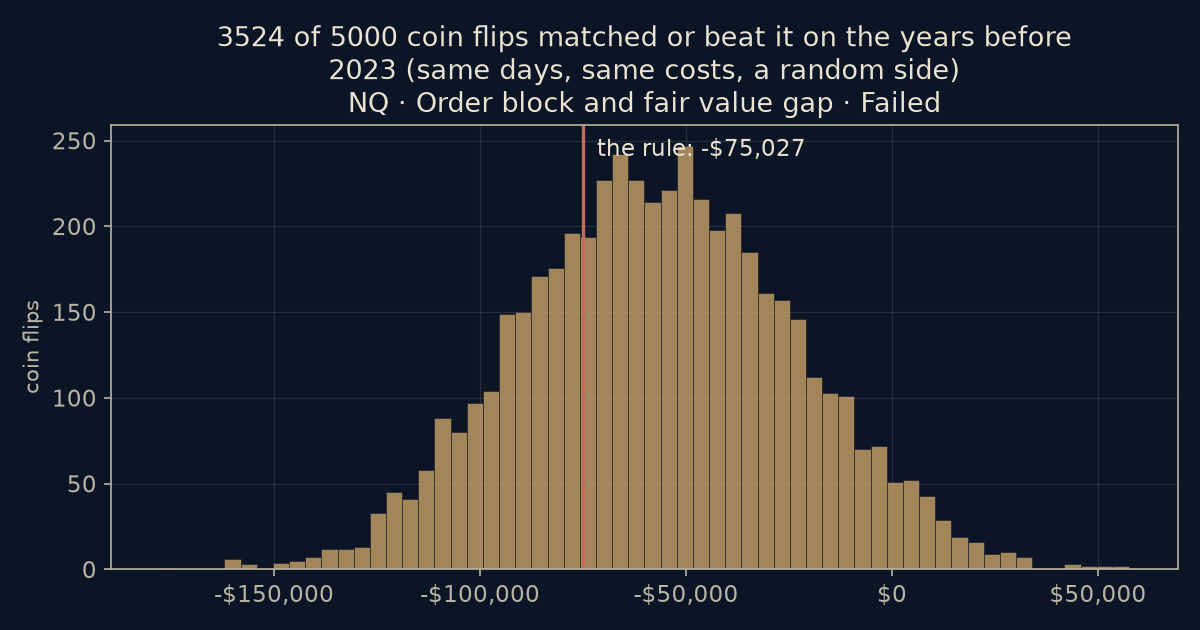
Against 5,000 coin flips the written strategy is a coin (3,524 of 5,000 matched or beat it on the years before 2023); whatever you do on top of the written steps is where any edge is, and your fills are how to find out which part.
Why it failed: it scored under half the points on the years before 2023 holding up, year after year, the coin flips, higher costs and a nudge to its settings.
How the 11 is made: clean data 5 of 5, the years before 2023 holding up 0 of 25, year after year 0 of 20, the coin flips 4 of 15, higher costs 0 of 20, a nudge to its settings 2 of 15. Passed is 70 or more with two more checks; Close is 40 to 69, or 70 or more that misses a check; Failed is under 40, or failed automatically (too few trades, or money only since 2023). How to read a report
What to do with this
Where it breaks
Where the written rule breaks: its shorts lose in both periods, -$32,284 from 2008 to 2022 and -$8,125 since 2023. What holds in both: its trades on Fridays, $9,555 and $11,125.
| 2008 to 2022 | since 2023 | |
|---|---|---|
| 10:00 AM | -$5,816 | $6,846 |
| 11:00 AM | -$28,849 | $7,579 |
| 12:00 PM | -$35,652 | $40,073 |
| 1:00 PM | -$49,554 | $24,078 |
| 2:00 PM | -$41,652 | $46,999 |
| 3:00 PM | -$53,620 | $41,485 |
Every number above is counted from this test’s own trades. A red edge loses in both periods, a green one makes money in both. Picking the best tile is fitting: test your own version and it is scored as a second try.
Or test fewer days, as we did for this setup (below): only after a wider-than-usual day, or only after a quieter one. Each opens the form with that one change filled in; the run is yours, free, private, by email.
What failed, and what to test next
Per contract, the typical trade was up $190 at its best and down $120 at its worst before it got out, against a stop $190 away.
780 of the 2,744 trades that ended at its stop (28%) were first up at least as much as they risked, then came all the way back to it. Taken the other way, the stopped trades were up that much first 27% of the time: it's how this market moves, not something this rule does, so changing the stop moves where a trade ends, not whether its entry has an edge.
None of these is the rule's own: what failed is the entry, and no change to the stop or the target fixes an entry.
How far each trade went for it and against it before it got out, held against the same trades taken the other way (the side the coin flips take). Read from this test’s own trades; nothing here is run or scored.
What we ran next
We ran the next one. The report’s one change for this setup is its main setting 10% either way, to see whether the result is the setting or the setup. Both, scored the same way as a second try. Live for 22 bars: Failed, 11 out of 100, 4,044 trades; 2008 to 2022 -$77,202 (3,516 of 5,000 coin flips as good); since 2023 $50,217. Live for 26 bars: Failed, 11 out of 100, 4,072 trades; 2008 to 2022 -$71,654 (3,445 of 5,000 coin flips as good); since 2023 $47,067.
We tested fewer days. The setups that came near a pass mostly trade rarely, so we kept this one to about half its days, both ways, with one condition (yesterday’s range against the 20 days before it), scored the same way as a second try. Only after a wider-than-usual day: Failed, 7 out of 100, 1,910 trades; 2008 to 2022 -$52,211 (3,805 of 5,000 coin flips as good); since 2023 $39,979. Only after a quieter-than-usual day: Failed, 9 out of 100, 2,132 trades; 2008 to 2022 -$24,584 (2,579 of 5,000 coin flips as good); since 2023 $8,095.
What to try next. Fewer trades. Of the setups that trade least (up to about 122 a year), 15 of 133 came near a pass; of the rest, 5 of 402. A condition that keeps fewer days is the first thing worth testing. What the setups that came near share →
Check your own trades
If you trade a version of this, the trade audit holds your own fills against the written rule and shows, in dollars, what your part adds or costs. Audit your trades →
A strategy the form doesn’t know goes by email, about a week.
The same setup on the other markets
Run unchanged, at the same settings, on 11 markets (the shelf’s six and five more; of those five, only a pass or a Close has a page of its own). Each one is its own test: picking the market that did best after the fact is how a backtest flatters itself. ES, NQ, YM and RTY are all stock-index futures and move together, so their agreeing is weaker evidence than it looks.
- ES Failed 11
- NQ Failed 11 this page
- YM Failed 11
- RTY Failed 11
- GC Failed 11
- CL Failed 11
- ZN Failed 11
- ZB Failed 11
- 6E Failed 11
- 6J Failed 11
- NG Failed 11
One of the setups in ICT order block: does it work?
One setup, tested, every week
The next verdict by email: what was tested, its score, and where it breaks. Free; leave with one click. Nothing on this site is held back for it.
Sent through Buttondown, the newsletter service you join yourself, as Privacy says.
The engine's report, in full
One trade a day, the first signal in the window, on one-minute bars, with one tick of slippage each way and commission. The coin flips are run on the years 2008 to 2022, kept apart from the years since 2023; the rest of the score uses all of them. Tested November 16, 2026, on data to October 30, 2026.
==============================================================
THINRIDGE ENGINE REPORT
==============================================================

SCOPE: FirstRate one-minute data, unadjusted; the rule exactly as locked; nobody checked it by hand.

1. THE RULE AS LOCKED
   setup type  : Order block and fair value gap
   as you locked it:
     Order block, at the settings the form starts with, run again on data to Oct 30, 2026: zone block; swing 5; age 24; trigger hold; window 9:45 AM to 3:00 PM; exit 3:30 PM; bar 5; mode follow; sides Both
     the years from 2023 kept apart, the split every shelf cell is scored on
   as the engine read it:
   exit model  : stop: one tick past the level the setup itself names (its swing, pattern end, zone edge or swept extreme)
               : target: none (time exit)
               : time exit: always kept as the backstop
   filter      : none
   tries       : #1
   bars        : signals on 5-minute bars built from the one-minute series by clock bucket; every fill, exit and cost is still on the one-minute series
   entries     : one trade a day, the first qualifying signal in the window
   history     : 18.8 years, kept apart from 2023 on (as declared)
               : trades dated 2023 or later are kept apart; the coin flips are run on the trades before 2023, the rest of the score on all of them

2. VERDICT
   SCORE   : 11 / 100
   VERDICT : FAILED
   UNDER HALF THEIR POINTS : the years before 2023, year to year, the coin flips, costs, nudging a setting
   THE SIX CHECKS : clean data 5 of 5; the years before 2023 0 of 25; year to year 0 of 20; the coin flips 4 of 15; costs 0 of 20; nudging a setting 2 of 15

3. RESULT
   Trades 4,059   Net -$27,542.80   Per trade -$6.79
   Since 2023     : 818 trades, $47,484.40
   Before 2023   : 3,241 trades, -$75,027.20
   Win rate 28.3%  (1149 of 4,059 trades closed above zero after costs)
   Exits by type: stop 2744, time 1315
   How it splits (every trade, one contract after costs):
                 trades            net     average   winners
   Long            2120     $12,866.00       $6.07       31%
   Short           1939    -$40,408.80     -$20.84       26%
   Monday           783      $4,091.40       $5.23       30%
   Tuesday          815     -$9,573.00     -$11.75       27%
   Wednesday        826    -$25,359.20     -$30.70       24%
   Thursday         816    -$17,382.20     -$21.30       30%
   Friday           819     $20,680.20      $25.25       30%
   A split is something to look at, not a new rule: keeping only the best side or day is a new version,
   and testing it counts as one more try.
   Time in a trade: half the trades last 49 minutes or less; the middle half between 14 minutes and 3 h 4 min; the longest 5 h 44 min.

4. THE COIN FLIPS (5,000 copies of the rule that pick the side at random)
   Full window  p = 0.2512  (1,256 / 5,000)
   Before 2023  p = 0.7048  (3,524 / 5,000)   <- the one the score uses
   Counting earlier tries, p (try #1) = 0.7048

5. YEAR BY YEAR (each year before 2023 a window)
   Years 15   profitable 3   profit factor before 2023 / since 0.79
   By year before 2023: 2008 -$8,139.20  2009 -$5,406.60  2010 $2,322.80  2011 $358.80  2012 -$63.80  2013 -$561.40  2014 $803.60  2015 -$12,243.80  2016 -$7,992.20  2017 -$9,894.60  2018 -$11,947.20  2019 -$6,653.00  2020 -$10,605.40  2021 -$590.40  2022 -$4,414.80

6. COST STRESS (re-simulated)
   1 tick -$27,542.80   2 ticks -$68,132.80   3 ticks -$108,722.80
   net kept after costs at 1 tick -91.5%   profit factor at twice the costs 0.92   Breakeven 0.0 ticks/side

7. FRAGILITY (5,000 resamples of the trades, drawn with replacement)
   Full   CI -$150,507.80 .. $97,197.20   P(net>0) 0.3284
   Pre-2023 CI -$152,982.20 .. $3,582.80   P(net>0) 0.0302
   bad-case drawdown (95th percentile) / actual 1.12x   Top trade n/a   Top-5 n/a

8. NUDGING A SETTING (the main setting moved 10% either way)
   Net kept on the nudge 0%   Turned to a loss: YES   Settings 5

9. COULD YOU HOLD IT (no points)
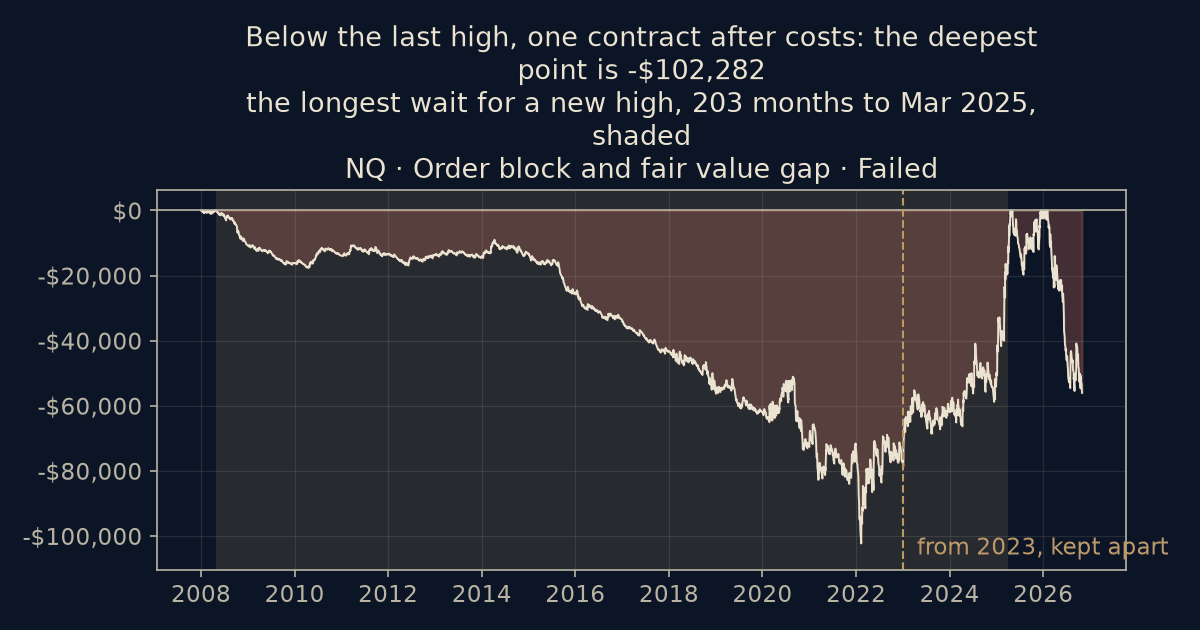
   Longest stretch without a new equity high: 203 months (ending 2025-03)
   Rolling 12-month windows negative: 62% of 215   Worst 12 months: -$30,047.60 (ending 2026-10)
   Max drawdown $102,281.60   Median year -$4,414.80   Years of median to recoup the drawdown: n/a (median year not positive)

10. THE CODE FILE (offered when all five hold)
   [ ] passed
   [ ] fewer than 1 in 20 coin flips matched it on the years before 2023, counting earlier tries
   [ ] the range of outcomes on the years before 2023 stays above zero
   [ ] it breaks even at 4 ticks of cost a side or more
   [ ] no single trade is over 25% of the net
   => not offered at this result.

11. HOW THE POINTS WERE COUNTED (each measure, then the points it earns)
   II, the years before 2023: steadiness kept on the years before 2023 (Sharpe ratio) -0.95 (per-trade) → 0 points; money on the years before 2023 → 0 points
   III, year to year: years profitable 0.2 → 0 points; profit factor before 2023 / since 0.79 → 0 points; one year's share → 0 points
   IV, the coin flips: coin-flip p 0.7048 (5,000 coin flips) → 0 points; bad-case drawdown / actual 1.12 → 4 points; top trade n/a → 0 points
   V, costs: net kept after costs -0.915 → 0 points; profit factor at twice the costs 0.92 → 0 points
   VI, nudging a setting: net kept on a nudge 0.0 → 0 points; settings counted 5 → 2 points; turned to a loss: yes → 0 points

12. THE AUTOPSY (where the money came from and went; the rule as it ran, no new try)
   Exits: stop 2744, -$1,037,899.80; time 1315, $1,010,357.00
   On the books, before 2023 (net -$75,027.20): 10:00 AM -$5,815.60  11:00 AM -$28,849.00  12:00 PM -$35,651.80  1:00 PM -$49,553.80  2:00 PM -$41,651.80  3:00 PM -$53,620.00
   Before 2023 -$75,027.20, since 2023 $47,484.40; largest year before 2023: 2010 (no share of the net: the years before 2023 lost money overall)
   Nudging a setting 10%: 0% of the net kept; turned to a loss: yes
   Flat stretch: 203 months without a new high (ending 2025-03); median year -$4,414.80; years of median to recoup n/a

   The stop is the rule: 2744 of 4059 exits were the stop (-$1,037,899.80), and the trades that were not stopped made $1,010,357.00. Longest wait for a new equity high: 203 months, median year -$4,414.80.
   The one next run, if you want it: the neighboring setting of the primary trigger (10% either way), as try #2. Prediction on file: a plateau under 25% means the neighbor rejects too; this run is to show it. Three such runs at most, then the verdict stands.

13. IF YOU TRADE THIS BY EYE
   The level did not hold: 68% of trades ended at the stop, which sits where the setup says price should not go; the setup's premise failed more often than it held.
   Against 5,000 coin flips the written rule is a coin (3524 of 5,000 matched or beat it on the years before 2023); whatever you do on top of the written steps is where any edge is, and your fills are how to find out which part.
   That is what the record says about the rule as written. It is not what next year says.

WHAT THIS CANNOT TELL YOU: the score assumes this rule walked in
once (see tries) and that your development did not touch the
years before 2023. Only you know both. Not investment advice. No
guarantee of future results. Statistical analysis of a mechanical
rule as submitted.
==============================================================
Raw market data: FirstRate Data (firstratedata.com). Statistical analysis of a mechanical strategy as written; not advice.