What you are looking at
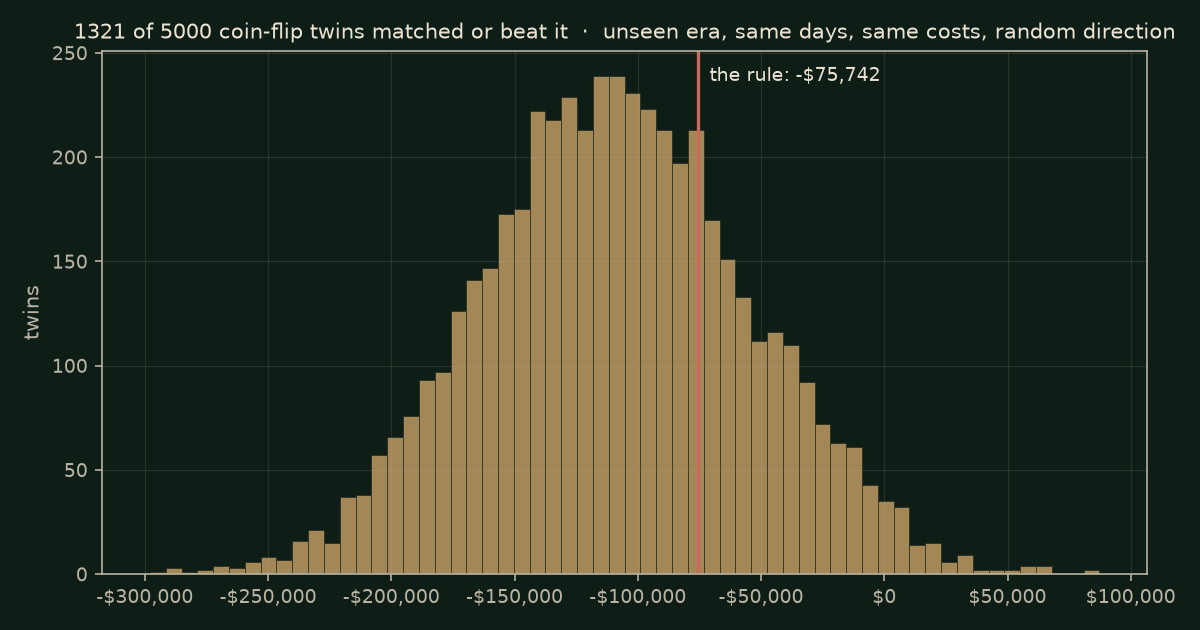
The rule is the one everyone knows: high and low of the first fifteen minutes from 9:30 ET, first five-minute close outside the range, in at the next bar with the break, both directions, no new trades after 11:30, flat at 15:30. On ES instead of NQ, at five-minute closes instead of one. Nothing was tuned. It was typed into the wizard the way a reader would type it, and this is what the engine sent back, 4,665 a tick a side plus commission and 5,000 random-direction twins later.
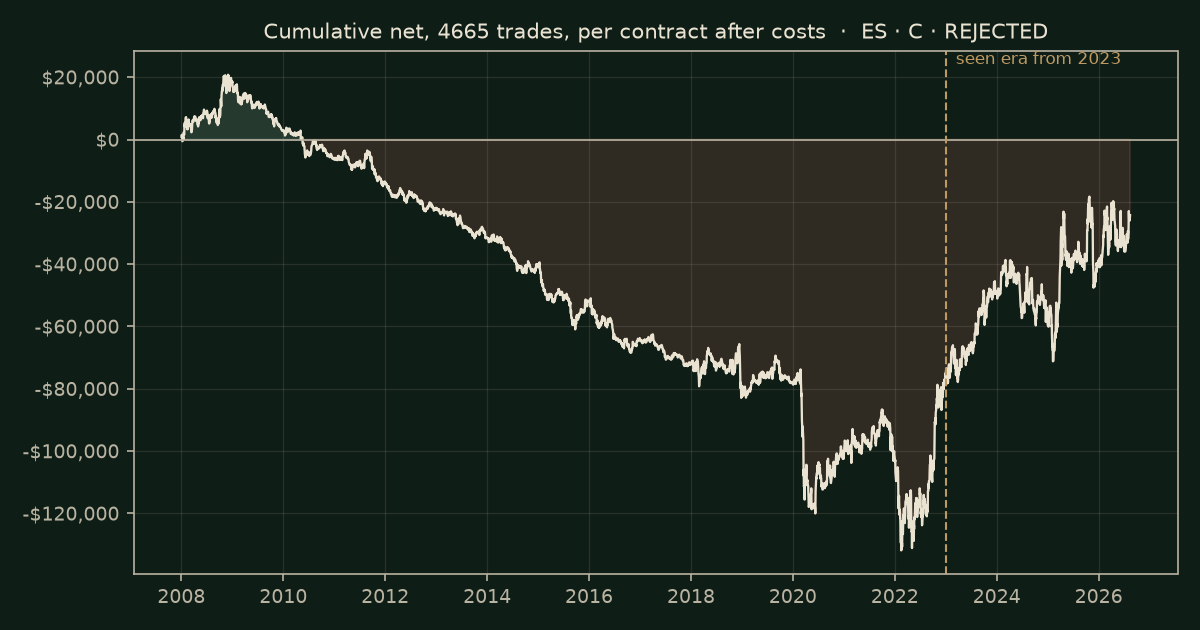
The three pictures are drawn by the engine from the run’s own record, and the report below is the text file exactly as delivered, down to the line that says what it cannot tell you. The verdict on this one is REJECTED at 11 of 100: it lost −$75,742 before 2023, 1,321 of the 5,000 twins did as well or better, and it spent 214 months under its 2008 high. A paid report on a rule that holds up looks the same, with different numbers and a code offer at the end.
The report, as delivered
Eleven sections. The rule as locked, the verdict, the result, the null, era consistency, cost stress, fragility, sensitivity, livability, the code offer, and the scoring lines that show where every point came from or did not.
==============================================================
THINRIDGE ENGINE REPORT  -  SCORED UNDER PROTOCOL v1.1
==============================================================

SCOPE: Scored under Protocol v1.1 on FirstRate 1-min unadjusted via Thinridge engine. Intake testimony: NOT received (rule tested as locked). Contamination map sworn: no (seen era as declared or by archive date). Human review of reconciliation residue: NO.

1. THE RULE AS LOCKED
   family      : C - Opening range breakout
   range_start : 930
   range_min   : 15
   last_entry  : 1130
   exit        : 1530
   mode        : follow
   sides       : Both
   bar         : 5
   reentry     : 1
   market      : ES
   exit model  : time only
   filter      : none
   lineage     : #1
   bars        : signals on 5-minute bars built from the one-minute series by clock bucket; every fill, exit and cost is still on the one-minute series
   entries     : one trade a day, the first qualifying signal in the window
   history     : 18.6 years, seen era = 2023 onward (declared by submitter, not sworn)
               : trades dated 2023 or later are the seen era; trades before 2023 are the unseen era, and the unseen era decides the verdict
   data        : 6,514,391 one-minute bars, 2008-01-02 to 2026-08-14
               : 0 lines excluded by the loader

2. VERDICT
   SCORE   : 11 / 100
   VERDICT : REJECTED
   CRATERS : pillar(s) below 50%: II, III, IV, V, VI
   Pillars : I=5  II=0  III=0  IV=4  V=0  VI=2

3. RESULT
   Trades 4665   Net -$24,280.50   Per trade -$5.20
   Seen era (2023+): 914 trades, $51,461.20
   Unseen era    : 3751 trades, -$75,741.70
   Win rate 48.0%  (2240 of 4665 trades closed above zero after costs)
   Exits by type: time 4665

4. THE NULL (random-side twins, 5000 seeds)
   Full window  p = 0.0692  (346 / 5000)
   Unseen era   p = 0.2642  (1321 / 5000)   <- governs
   Lineage-adjusted p (variant #1) = 0.2642

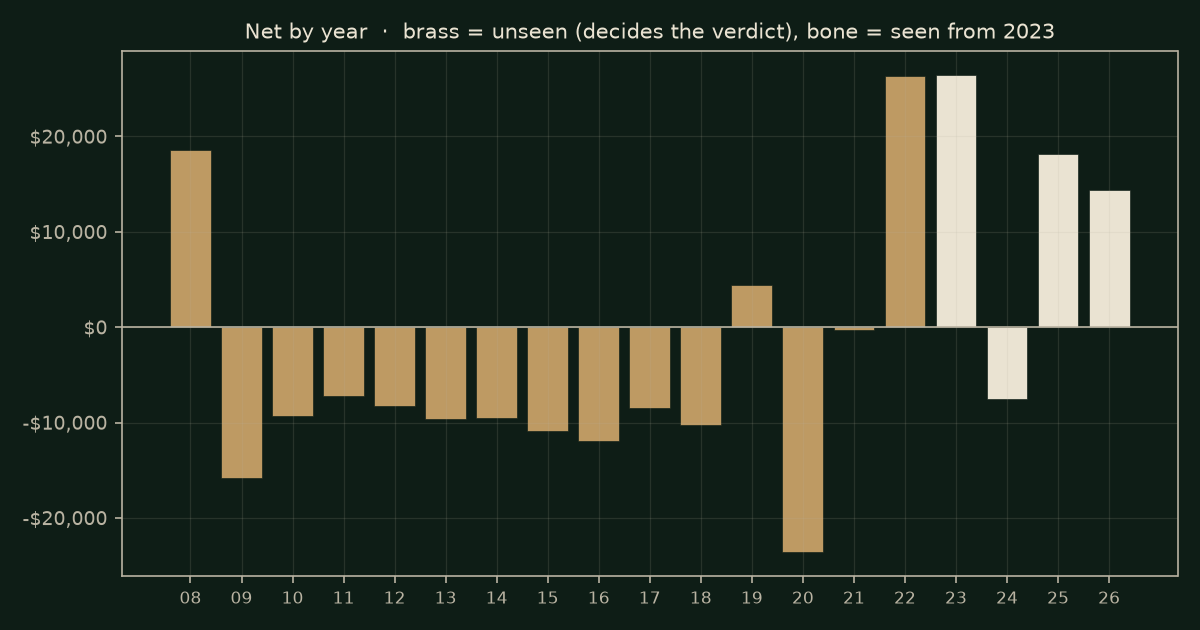
5. ERA CONSISTENCY (unseen calendar years as windows)
   Years 15   profitable 3   WF efficiency (PF unseen/seen) 0.85
   By year (unseen): 2008 $18,595.60  2009 -$15,762.60  2010 -$9,266.80  2011 -$7,212.60  2012 -$8,229.10  2013 -$9,600.00  2014 -$9,541.60  2015 -$10,854.10  2016 -$11,887.50  2017 -$8,487.30  2018 -$10,283.40  2019 $4,383.60  2020 -$23,612.50  2021 -$299.90  2022 $26,316.50

6. COST STRESS (re-simulated)
   1 tick -$24,280.50   2 ticks -$140,905.50   3 ticks -$257,530.50
   Net/gross at 1 tick -21.7%   PF at 2x friction 0.91   Breakeven 0.0 ticks/side

7. FRAGILITY (bootstrap x5000)
   Full   CI -$173,643.00 .. $123,719.50   P(net>0) 0.3740
   Unseen CI -$183,116.70 .. $32,108.30   P(net>0) 0.0860
   DD95/actual 0.88x   Top trade n/a   Top-5 n/a

8. SENSITIVITY (+-10% on primary trigger)
   Plateau retention 0%   Sign flip YES   Parameters 5

9. LIVABILITY (no points; could a person have held this?)
   Longest stretch without a new equity high: 214 months (ending 2026-08)
   Rolling 12-month windows negative: 69% of 213   Worst 12 months: -$41,633.00 (ending 2020-05)
   Max drawdown $152,643.10   Median year -$8,229.10   Years of median to recoup the drawdown: n/a (median year not positive)

10. CODE OFFER
   [ ] validated
   [ ] unseen_p_adj_le_0.05
   [ ] unseen_ci_excludes_zero
   [ ] breakeven_ge_4_ticks
   [ ] top_trade_le_25pct
   => not offered at this result.

11. SCORING LINES
   II: Sharpe retention -0.68 (per-trade) -> 0; absolute OOS -> 0
   III: windows profitable 0.2 -> 0; efficiency 0.85 -> 0; window concentration -> 0
   IV: null p 0.2642 (5000 seeds) -> 0; DD95/BT 0.88 -> 4; top trade n/a -> 0
   V: retention@1x -0.217 -> 0; PF@2x 0.91 -> 0
   VI: plateau 0.0 -> 0; parsimony 5 -> 2; sign flip True -> 0

WHAT THIS CANNOT TELL YOU: the score assumes this rule walked in
once (see lineage) and that your development did not touch the
unseen era. Neither was sworn. A Thinridge audit exists to take
that testimony. Not investment advice. No guarantee of future
results. Statistical analysis of a mechanical rule as submitted.
==============================================================
Run yours
Any mechanical rule on NQ, ES or RTY, stated in plain words or in code, goes through the bench: the same engine, $49, delivered in minutes, and the report shows the rule with and without every condition you add. Reader rules also get run for free on the public runs page, one a month, published whatever they show.