The rule
A 20-period Keltner channel on one-minute bars, bands at 2.0 × ATR. When price closes above the upper band, sell; below the lower band, buy. Hold sixty minutes, then market out. Signals between 9:30 and 15:00 ET only, both sides, one contract, NQ, no stop.
This is the channel rule as it appears in the indicator’s own documentation and in most of the videos that teach it. Nothing added. Submitted August 22, 2026, declared version #1 with a seen-from year of 2023, and scored by the engine under Protocol v1.1.
The verdict
11 out of 100. Rejected. No gate, because there is no edge for a gate to catch. Five of six pillars below half credit. The only points it scored were for clean data, a drawdown that matched its own reshuffled distribution, and having five parameters instead of seven.
| Era | Years | Trades | Net result |
|---|---|---|---|
| Unseen (2008–2022) | 15 | 3,868 | −$71,216 |
| Seen, as declared (2023–2026) | 3.6 | 933 | −$131,899 |
| Full window | 18.6 | 4,801 | −$203,114 |
It lost $42 a trade, before anyone made a mistake executing it.
Year by year, unseen era
| Year | Net | Year | Net |
|---|---|---|---|
| 2008 | −$5,753 | 2016 | −$14,229 |
| 2009 | −$9,714 | 2017 | −$5,594 |
| 2010 | −$6,829 | 2018 | −$5,094 |
| 2011 | −$8,604 | 2019 | −$10,169 |
| 2012 | −$6,185 | 2020 | +$52,792 |
| 2013 | −$3,559 | 2021 | −$9,574 |
| 2014 | −$4,829 | 2022 | −$35,474 |
| 2015 | +$1,596 |
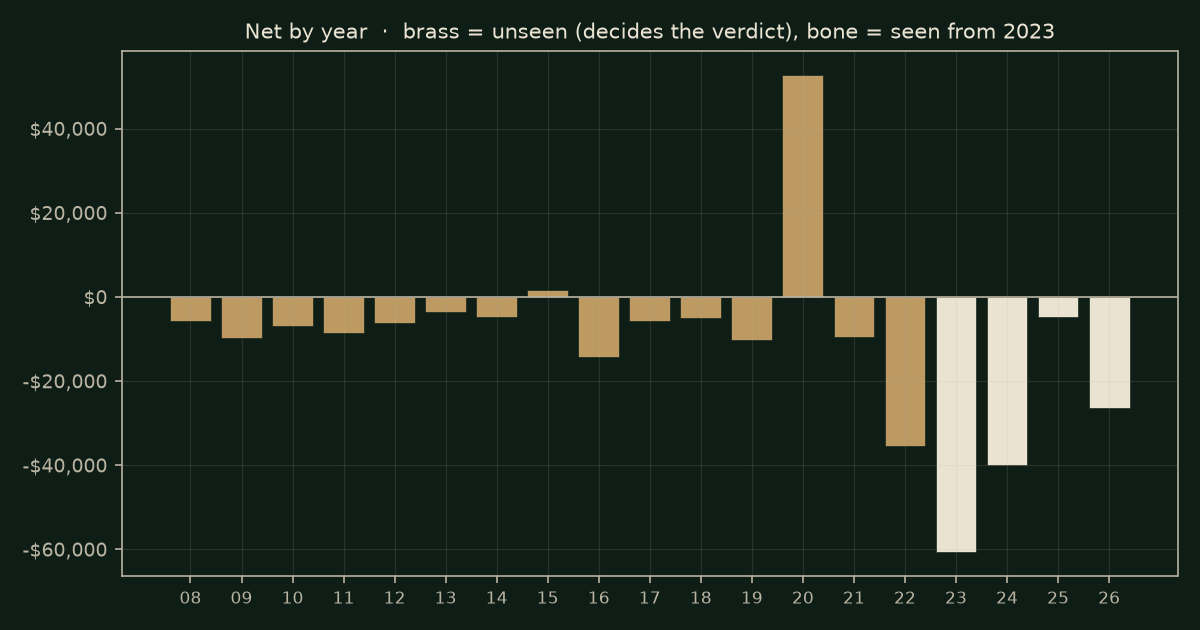
Two of fifteen years positive. 2020 made $52,800 and is the only year that would have kept anyone in the trade; 2022 gave back $35,500 of it. Every other year is a slow, even bleed of $4,000 to $14,000. The seen era is worse than the unseen: since 2023 the rule has lost $132,000 in three and a half years, more than it lost in the fifteen before.
Compared to what? The coin-flip test
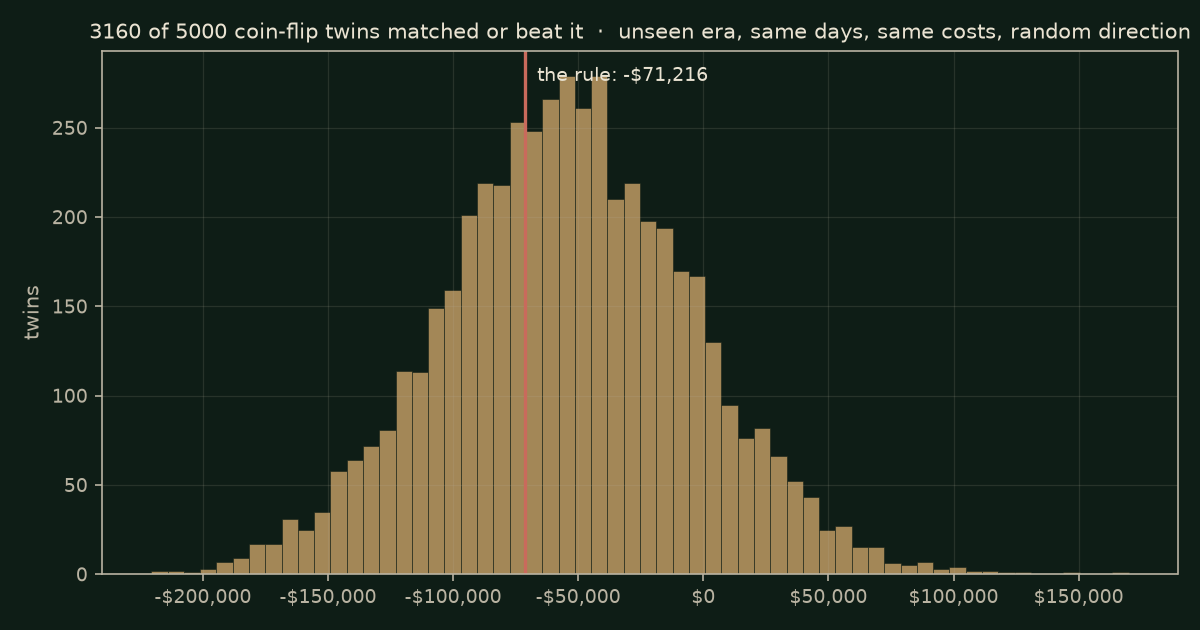
Five thousand twins, same bars, same costs, coin-flip direction. Full window: p = 0.94; the rule lost to 94% of its own coin flips. Unseen era: p = 0.63.
A rule that loses to nineteen of twenty random-direction twins over 4,801 trades is not unlucky. The direction call is wrong more often than a coin.
Costs
Net is 0% of gross; gross is negative, so there is nothing for costs to take. Two ticks per side: −$251,124. Three: −$299,134. Breakeven is 0.0 ticks: it does not break even at zero friction.
Sensitivity
Plateau retention 0%. Sign flip: yes. That second line deserves a sentence. Moving the multiplier ten percent in either direction flipped the sign of the result somewhere in the neighbourhood. A tuner who sweeps 1.8, 2.0, 2.2 will find a setting that made money and ship it. That is how this rule gets sold with a backtest attached. The plateau is what matters, and the plateau is zero.
Livability
The score says whether the edge is real. This section says whether a person could have held it. No points attach.
| Longest stretch without a new equity high | 223 months (ending August 2026, the end of the data) |
| Rolling 12-month windows that lost money | 83% of 213 |
| Worst 12 months | −$77,074 (ending February 2025) |
| Maximum drawdown | $234,625 |
| Median year | −$6,829 |
| Years of median to recoup the drawdown | n/a — the typical year recoups nothing |
| Share of all profit from the best two years | n/a — there is no profit |
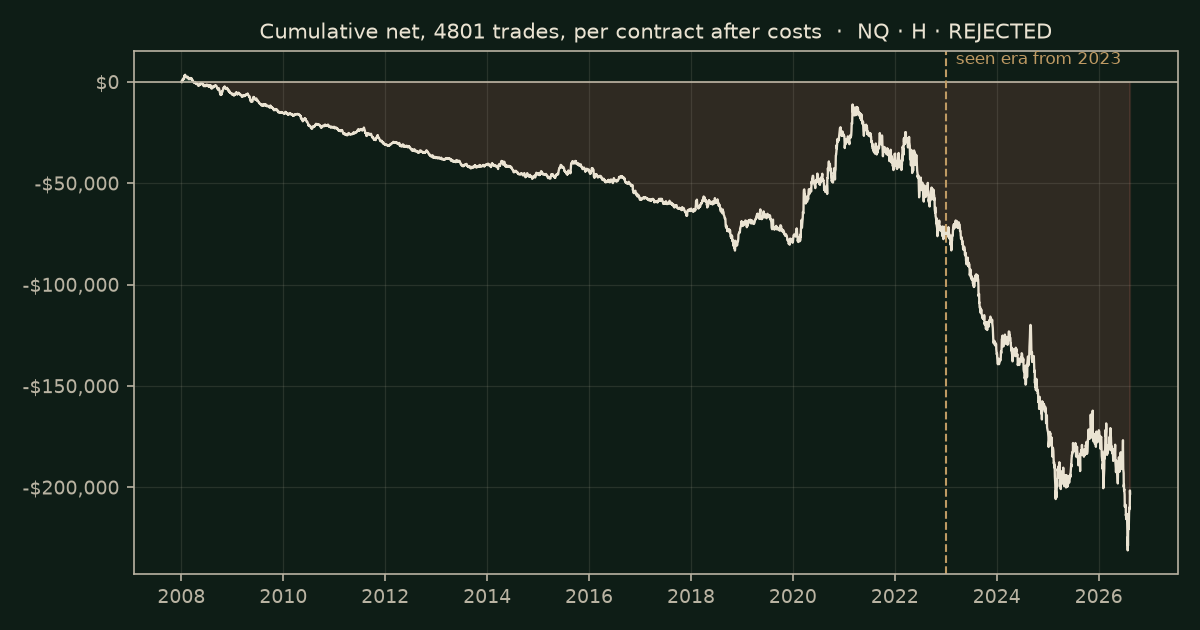
A person running this on one contract since 2008 has been underwater the entire time.
Verdict
REJECTED — 11/100. No gate tripped; none was needed. The data was clean (6,180,656 bars, zero anomalies), the fills were honest (next-bar-open market orders, one tick adverse per side), and the result reproduces from the rule text above. The evidence is valid. It says no, at every test.
Reproducibility
Anyone with NQ 1-minute data for 2008–2026 and the rule as written above should land within Protocol tolerance (±10%) of 4,801 trades and −$203,114 net at $4.20 commission and one tick per side. The full engine report, number 474cc83d4b, is on file. If you run it and land materially elsewhere, we want to hear about it.
Questions people ask
Does the Keltner channel fade work? As documented, no. Close outside the 20/2.0 ATR band, trade back toward the centre, out in an hour: 4,801 trades on 18 years of 1-minute NQ lost $203,114 and the equity curve was never above zero.
How does it compare to random? 94% of 5,000 random-direction twins did as well or better on the same days. Only 2 of the 15 unseen years were positive.
Would different settings help? No. Every neighbouring setting tested also lost, the sensitivity plateau was 0%, and the result flips sign under a 10% change in the primary parameter, which is the signature of a rule with nothing under it.
Methods honesty — the correction ledger
- This is the first page scored under the signed Protocol v1.1 rather than its draft; the rubric is unchanged from draft.3, so the earlier bench run (also 11) and this wizard run agree to the cent.
- The engine report omits the “best two years” Livability line when net is negative rather than printing n/a. Cosmetic; logged.
What this cannot tell you
The engine tested the fade. The twins say the fade sits in the 94th percentile of coin flips, which means following the band instead would have sat in the 6th. That is a different rule, not a conclusion: it was not submitted, it was not tested, and “if fading loses, following wins” is the kind of sentence that has cost people money for a century. If you want the follow version scored, submit it at thinridge.io; a filter is scored as a second strategy and shown beside the base. Once a month we take one reader-submitted variant of a published rule, test it free under a frozen specification, and publish the result either way.
The score assumes this rule walked in once and that development did not touch 2008–2022. Neither was sworn.
Where the money was
The numbers are a spike: a 10% nudge either way keeps 0% of the result. Longest wait for a new equity high: 223 months, median year -$6,828.60.
The one next run, if a reader wants it: the neighboring setting of the primary trigger (10%% either way), as lineage #2. Prediction on file: a plateau under 25%% means the neighbor rejects too; this run is to show it. Three such runs at most, then the verdict stands.
If you trade this by eye
Against 5,000 coin flips the written rule is a coin (3160 of 5,000 matched or beat it on the unseen years); whatever you do on top of the written steps is where any edge is, and your fills are how to find out which part.
That is what the record says about the rule as written. It is not what next year says.
A course, a bot, a signal room, or an evaluation you’d trade it in: the same test that made this page runs on the rule as the seller states it, for $49, before the card goes through. Read this before you pay →
The standing challenge
Once a month we take one reader-submitted variant of a published rule, test it free under a frozen specification, and publish the result either way. This is the one teardown nobody has yet asked us to vary, which is its own finding: the Keltner fade as documented never crossed zero in eighteen years, and no reader has claimed a version that does. If you trade one, with a different length, multiplier, session or exit, write it down in numbers and submit it at thinridge.io. A filter is scored as a second strategy and shown beside the base, and your lineage declaration will be held to the same standard this one was.