Does the setup you were taught actually work?
18 years of one-minute futures data. Every trade, after costs, against 5,000 coin flips. Published whether it passes or fails.
Passed70 or more, no check under half its points, no automatic fail, and two more checks.
Close40 to 69, or 70 or more that misses a check.
FailedUnder 40, or failed automatically whatever the score.
Coin flipsHow many of 5,000 random-side copies did as well on 2008 to 2022. Fewer is better.
Longest waitThe most months it went without a new equity high.
How the score is made, in one paragraph
The coin flips, the years-before-2023 check and the year-by-year check are scored on the 15 years before 2023 (2008 to 2022), kept apart from the years since: 60 of the 100 points; the other three checks use all 18. For a setup that trades both ways the coin flips test the side it takes, not when it trades or when it sits out. They take the setup’s own trades with the side picked at random (for a one-way setup, the timing). When many do as well, the setup adds nothing a coin doesn’t. How to read a result
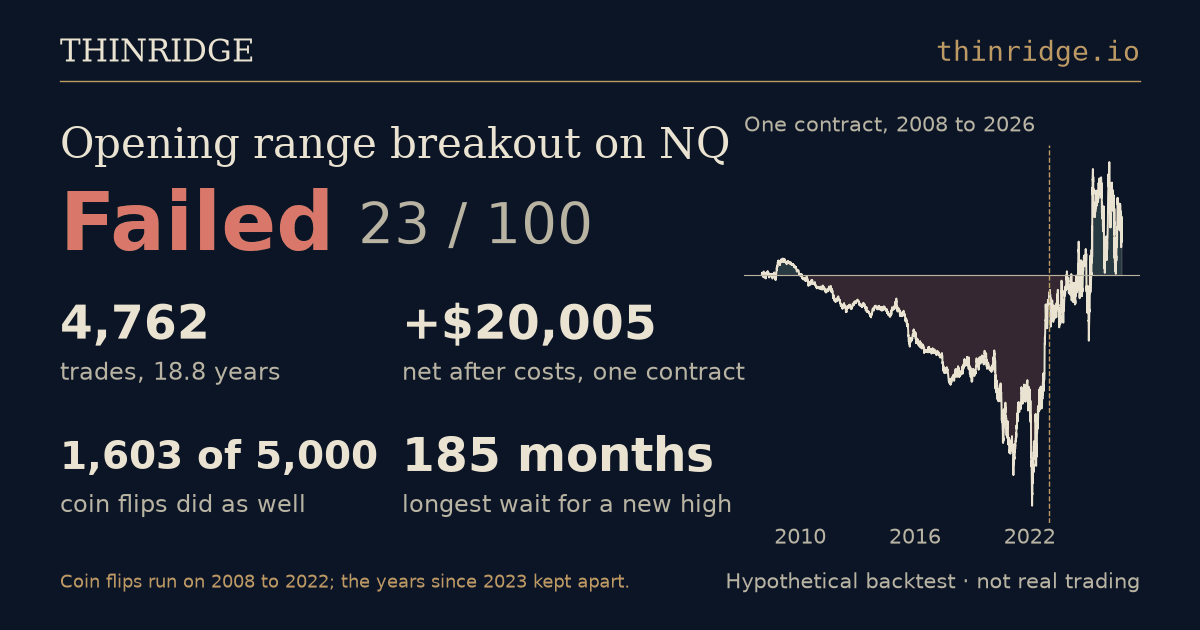
Tested with no stop and no target. Made $20,005 and still failed: 1,603 of 5,000 coin flips did as well.
One that passed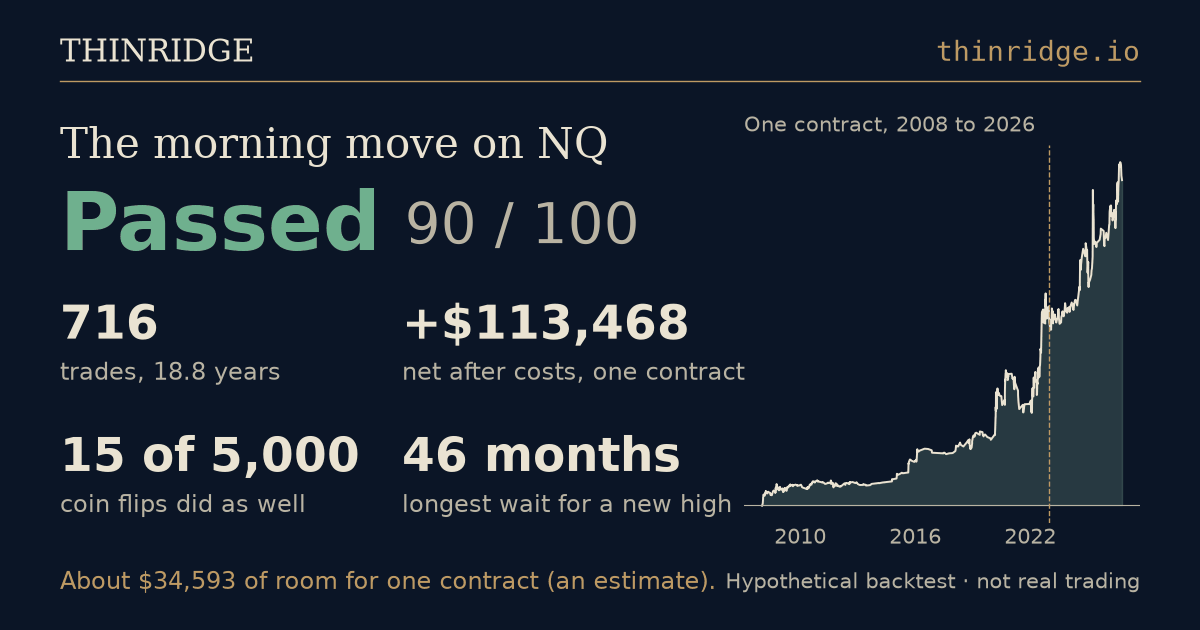
Real, and slow: 46 months without a new high.
The one everyone tries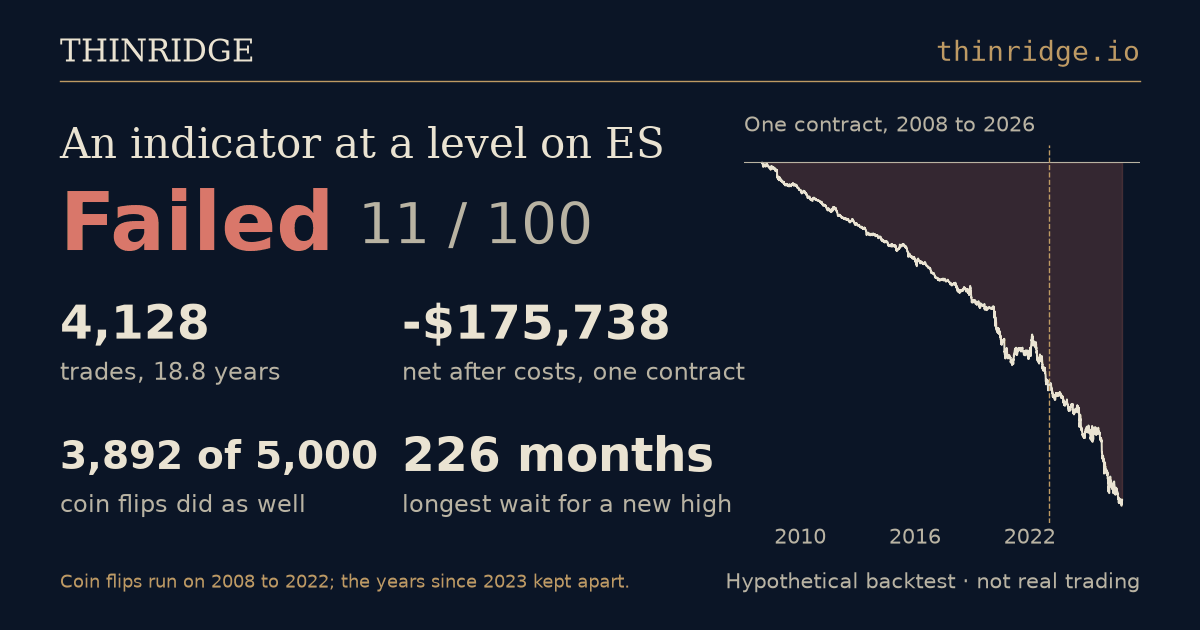
Buy when RSI drops under 30: lost $175,738 over 4,128 trades.
Test your strategy
- Pick a setup, or describe your own
- 18 years of data
- Score in your inbox, free
Find what you do right
- Upload your trades, free
- Trade it your own way? Your fills against the mechanical version
- What each habit made or cost
- A made-up sample: skipped trades cost $9,714
- 1. DescribePick a setup, or say yours the way you would to a friend.
- 2. ReplayEvery trade on one-minute futures data from 2008, after a tick a side and $4.20 a round turn.
- 3. CompareAgainst 5,000 coin flips that take its trades with the side picked at random.
- 4. Score0 to 100: Passed, Close or Failed, and what to try next.
Free and private. Nobody here earns when you trade: no commissions, no affiliate links, no sponsor who does. Who pays for this →
Pass or fail, the report says what we would run next, and for every setup on the shelf the page shows what that run did, scored as a second try, or why there was none to run. A strategy back in minutes; a trade audit read back in one business day and done in three. What a report looks like →
ICT, tested. Fair value gaps, the Silver Bullet, order blocks, killzones: what 18 years of futures data say about each. The ICT ideas →
You asked, we ran. Readers bring an idea; we test it in the open, misses included. Latest: the opening range breakout, taken only when the break is already past the premarket range: on NQ, on the data to August 14, it went from 28 to 80. What happened next →
Filed before it happened. Four rules, sealed with a fingerprint on November 4, 2026, before any later month was seen: the three that passed on the shelf, and one survivor of a search of about 640 rules, filed as a test of luck; checked after every data download, misses included. The filing →
The morning move passed on three of the shelf’s six markets
8:00 to 9:30 move of 0.4% or more · trade against it at 9:30 · out at 10:15 · one trade a day
The morning move is our own strategy (TR-26-0003). It was built on NQ, then run unchanged on all 65 markets on the engine in September 2026, on data to August 14, 2026: it passed on five under today’s rule (six under September’s), all stock indices. Its six shelf markets are below, each dated on its own page. Stock index futures move together, so passes on several of them are closer to one finding than several.
Coin flips: how many of 5,000 random-side copies did as well on 2008 to 2022, fewer is better · new high: the longest wait between equity highs · room: an estimate of what one full-size contract needs to ride out a stretch worse than its own worst (from its 95th-percentile drawdown); not a guarantee and not broker margin
NQ
716 trades · net $113,468 · coin flips 15 / 5,000 · 46 months without a new high
Since 2023, the years kept apart: 162 trades, $49,775.
room for one contract: about $34,593 (an estimate)
YM
479 trades · net $27,428 · coin flips 37 / 5,000 · 61 months without a new high
Since 2023, the years kept apart: 77 trades, $2,552.
room for one contract: about $15,363 (an estimate)
RTY
797 trades · net $40,473 · coin flips 4 / 5,000 · 36 months without a new high
Most of the profit came from 2021 and 2025.
Since 2023, the years kept apart: 197 trades, $11,608.
room for one contract: about $14,575 (an estimate)
Every setup, tested the same way
3 passed, 15 close, 280 failed, 2 made no trades. Tap a setup for its six markets, or a market for every setup on it. Under All six, each setup shows its best market’s score. ES S&P · NQ Nasdaq · YM Dow · RTY Russell · GC Gold · CL Oil. A score is how a setup did against our published checks on 2008 to 2026; it is not a forecast, and what it does next is unknown. How a score is made.
Bars: net by year, 2008 to 2022, the years the coin flips are run on; the years since are on each cell. Amber made money, red lost it; a gap is a year with no trades. Passed: 70 or more, no check under half its points, no automatic fail, and two more checks. Close: 40 to 69, or 70 or more that misses one of them. Failed: under 40, or failed automatically whatever the score (its money all from 2023 on, money made before 2023 and lost since, or too few trades).
Since 2023: ES +$15k · NQ +$50k · YM +$3k · RTY +$12k · GC -$14k · CL -$3k
Since 2023: ES +$5k · NQ +$11k · YM +$3k · RTY -$9k · GC +$6k · CL -$14k
Since 2023: ES -$39k · NQ -$48k · YM +$6k · RTY -$12k · GC -$17k · CL +$87
Since 2023: ES +$1k · NQ -$349 · YM +$1k · RTY +$4k · GC +$2k · CL +$5k
Since 2023: ES +$262 · NQ +$52k · YM +$3k · RTY +$22k · GC +$15k
Since 2023: ES -$34k · NQ +$75k · YM -$54k · RTY -$20k · GC -$19k · CL -$45k
Since 2023: ES -$17k · NQ +$7k · YM -$3k · RTY +$2k · GC -$7k
Since 2023: ES -$32k · NQ +$71k · YM +$12k · RTY -$19k · GC -$17k · CL -$12k
Since 2023: ES -$3k · NQ -$4k · YM -$10k · RTY +$18k · GC +$13k · CL +$23k
Since 2023: ES -$37k · NQ +$26k · YM -$84k · RTY -$7k · GC +$12k · CL -$37k
Since 2023: ES +$8k · NQ +$10k · YM +$11k · RTY -$6k · GC -$20k · CL -$9k
Since 2023: ES +$9k · NQ +$42k · YM +$17k · RTY +$10k · GC -$36k · CL -$3k
Since 2023: ES +$125 · NQ +$26k · YM +$1k · RTY +$2k · GC -$29k · CL +$8k
Since 2023: ES -$27k · NQ +$52k · YM -$7k · RTY -$16k · GC -$31k · CL -$38k
Since 2023: ES -$14k · NQ +$68k · YM -$2k · RTY -$22k · GC +$163k · CL -$25k
Since 2023: ES -$8k · NQ -$5k · YM -$3k · RTY -$6k · GC -$26k · CL +$1k
Since 2023: ES +$15k · NQ -$74k · YM +$21k · RTY -$6k · GC -$36k · CL +$4k
Since 2023: ES +$10k · NQ +$22k · YM -$40k · RTY -$2k · GC -$32k · CL -$17k
Since 2023: ES +$74k · NQ +$60k · YM -$9k · RTY -$26k · GC -$29k · CL -$28k
Since 2023: ES +$5k · NQ +$49k · YM -$36k · RTY +$11k · GC +$19k · CL -$11k
Since 2023: ES -$8k · NQ +$52k · YM +$5k · RTY +$4k · GC +$35k · CL -$65k
Since 2023: ES +$5k · NQ -$93k · YM -$17k · RTY -$437 · GC -$47k · CL -$8k
Since 2023: ES +$23k · NQ +$14k · YM +$43k · RTY -$8k · GC -$13k · CL -$26k
Since 2023: ES -$10k · NQ -$11k · YM -$13k · RTY +$2k · GC -$18k · CL -$26k
Since 2023: ES -$11k · NQ -$6k · YM -$1k · RTY -$13k · GC -$66k · CL -$4k
Since 2023: ES +$58k · NQ +$36k · YM -$3k · RTY -$9k · GC -$60k · CL -$30k
Since 2023: ES +$17k · NQ +$36k · YM -$10k · RTY -$2k · GC -$14k · CL -$18
Since 2023: ES -$53k · NQ -$59k · YM -$7k · RTY -$33k · GC -$24k · CL -$17k
Since 2023: ES -$16k · NQ +$56k · YM +$10k · RTY -$17k · GC -$3k · CL +$21k
Since 2023: ES -$28k · NQ -$62k · YM +$486 · RTY -$29k · GC +$4k · CL -$28k
Since 2023: ES -$23k · NQ -$139k · YM +$31k · RTY -$7k · GC +$28k · CL -$22k
Since 2023: ES -$19k · NQ -$18k · YM +$7k · RTY -$12k · GC -$5k · CL -$6k
Since 2023: ES -$12k · NQ -$53k · YM -$13k · RTY -$10k · GC -$33k · CL -$17k
Since 2023: ES -$35k · NQ -$92k · YM +$10k · RTY +$18k · GC -$25k · CL -$7k
Since 2023: ES -$58k · NQ +$22k · YM -$405 · RTY -$13k · GC -$47k · CL -$26k
Since 2023: ES -$23k · NQ -$4k · YM -$19k · RTY -$24k · GC -$78k · CL -$28k
Since 2023: ES -$34k · NQ +$39k · YM -$18k · RTY -$16k · GC -$72k · CL -$1k
Since 2023: ES +$29k · NQ +$30k · YM -$6k · RTY -$11k · GC +$22k · CL -$39k
Since 2023: ES -$32k · NQ -$34k · YM +$1k · RTY -$16k · GC -$35k · CL -$10k
Since 2023: ES -$4k · NQ +$4k · YM +$453 · RTY +$17 · GC +$4k · CL +$223
Since 2023: ES +$11k · NQ +$47k · YM -$24k · RTY -$11k · GC -$35k · CL -$30k
Since 2023: ES -$12k · NQ +$46k · YM -$18k · RTY -$9k · GC -$41k · CL -$51k
Since 2023: ES -$51k · NQ -$115k · YM +$35k · RTY +$1k · GC -$15k · CL -$4k
Since 2023: ES -$35k · NQ -$49k · YM -$21k · RTY +$1k · GC +$52k · CL -$2k
Since 2023: ES -$40k · NQ -$20k · YM +$7k · RTY -$25k · GC -$48k · CL -$22k
Since 2023: ES +$17k · NQ -$31k · YM +$7k · RTY +$7k · GC -$52k · CL -$1k
Since 2023: ES -$9k · NQ -$58k · YM +$24k · RTY +$10k · GC +$6k · CL +$1k
Since 2023: ES -$59k · NQ -$77k · YM -$32k · RTY -$18k · GC -$3k · CL -$9k
Since 2023: ES -$69k · NQ -$14k · YM -$38k · RTY -$35k · GC -$64k · CL -$22k
Raw market data: FirstRate Data.
Five more markets
The same 50 setups, unchanged, on five markets that aren’t stock indices, gold or oil: the 10-year note, the 30-year bond, the euro, the yen and natural gas. 250 tests: 0 passed, 2 close, 235 failed, 13 made no trades.
| Passed | Close | Failed | No trades | Median | |
|---|---|---|---|---|---|
| ZN | 0 | 0 | 48 | 2 | 13 |
| ZB | 0 | 0 | 48 | 2 | 13 |
| 6E | 0 | 1 | 46 | 3 | 11 |
| 6J | 0 | 0 | 47 | 3 | 11 |
| NG | 0 | 1 | 46 | 3 | 11 |
| All five | 0 | 2 | 235 | 13 | 13 |
| The six above | 3 | 15 | 280 | 2 | 11 to 13 |
The two that came close: Distance from VWAP on 6E (48), The 38.2% pullback on NG (47). One of the two came close on NQ as well.
Not one setup passed on any of the five. Whatever holds these setups back, it isn’t that they were only tried on stock indices.
ZN 10-year note · ZB 30-year bond · 6E euro · 6J yen · NG natural gas. Each setup at its shelf settings, 5,000 coin flips each on the years before 2023. Declared October 30, 2026, with six predictions filed before the run; all six held. Run November 1, 2026. Raw market data: FirstRate Data.
One setup, tested, every week
The next verdict by email: what was tested, its score, and where it breaks. Free; leave with one click. Nothing on this site is held back for it.
Sent through Buttondown, the newsletter service you join yourself, as Privacy says.
Before you read that as “nothing works”
A failed score is a verdict on the written steps, taken every time.
Every score above is the strategy as written: every signal, every day, for 18 years, with no judgment. That is the part that can be written down and tested. What a trader does on top of it, the days skipped, the trades cut short, the ones taken off-plan, is not in the test. It can be measured.
Test the written half
Describe the setup as it is taught. It runs on 18 years of one-minute data, after costs, against 5,000 coin flips, and the result shows where it breaks: by side, by weekday, by the hour it closed. Each is one change to test, as a second version.
Measure your half
Send your real fills. The audit runs your rule over the same days and prices every difference, in dollars: what your skips, your early exits and your off-plan trades made or cost. On the sample, a made-up trader labelled as such: skipped −$9,714, cut early +$7,670, not the rule’s +$4,231; +$2,187 in all. It can come out negative.
The verdicts
Famous setups, written up in full. Each ran as its write-up ran it (its own bars, years and exits), so its numbers can differ from the same setup on the shelf above, which runs every setup the same default way. Each card says when it ran and on what data: these ran in August and September on the data to August 14; the shelf above was run again on the data to October 30, so the same setup can show other numbers there (the opening range breakout on NQ: 4,708 trades and 28 here, 4,762 trades and 18 on the shelf). Click one.
Bullish engulfing candle
Studied by hand, 15-minute bars, 2010 to 2025
As taught in every book. 2,853 trades over 16 years, -$58k. 25 of 25 settings negative.
Opening range breakout
Run August 21, 2026, on data to August 14
4,708 trades, +$34k over 18.6 years. Against 5,000 coin flips the written strategy is a coin (1,716 of 5,000 matched or beat it on 2008 to 2022).
The morning move
Run August 22, 2026, on data to August 14
709 trades, +$113k over 18.6 years (716 trades and $113,468 in the shelf’s November run). It beat the coin flips and it is slow: 46 months without a new high is in the record. Whether the edge is real, a backtest can’t say; the forward record will.
Keltner channel fade
Run August 22, 2026, on data to August 14
4,801 trades, -$203k over 18.6 years. Against 5,000 coin flips the written strategy is a coin (3,160 of 5,000 matched or beat it on 2008 to 2022).
Opening range breakout, Fridays
Run August 24, 2026, on data to August 14
925 trades, +$142k over 18.6 years. Patience past noon is where this strategy's money has lived; before noon it paid costs for nothing. The shelf's opening range breakout with one condition, Fridays only; without it the same strategy fails on every market. Found on the seventh try, so it is held at Close.
Silver bullet
Run September 5, 2026, on data to August 14
2,372 trades, -$22k over 18.6 years. Against 5,000 coin flips the written strategy is a coin (4,628 of 5,000 matched or beat it on 2008 to 2022).
Failed breakdown
Run September 17, 2026, on data to August 14
1,362 trades, -$81k over 18.6 years. The level did not hold: 75% of trades ended at the stop, where the setup says price should not go.
Two tests at the VWAP band
Run September 20, 2026, on data to August 14
2,557 trades, -$122k over 18.6 years. A reader's setup; against 5,000 coin flips the written strategy is a coin on both markets.
Two tests at the VWAP band, on his hours
Run September 20, 2026, on data to August 14
2,734 trades in four records, -$73k. The same reader's setup on the two sessions he trades, ES and gold; a coin on every one.
A strategy the form doesn’t know?
Say it here. It is read back to you before anything runs; a kind the engine lacks is built by a person, about a week.